
Introduction
Actually, while some IT professionals are aware of the quality of the extensive network management, others still don’t realize the huge benefit of monitoring the bandwidth usage within a network. You will miss some significant benefits if you are managing your network without using the network bandwidth monitor.
In fact, the network bandwidth monitor will enable you to assess the quantity of bandwidth needed for your businesses and notify you if any performance issues may happen with your internet service.
As we had mentioned in our previous article on the cacti installation, that graphing is its greatest strength, it has many other powerful features. In fact, cacti is an excellent system to monitor your bandwidth usage.
Enable SNMP on the Network Devices
SNMP stands for simple network management protocol. It is a way that servers can share information about their current state, and also a channel through which an administer can modify predefined values. While the protocol itself is very simple, the structure of programs that implement SNMP can be very complex.
In this article we will show you how to enable and configure SNMP in the Cisco switch/router. If you have others equipment you need to review your router’s documentation for more details specific to your router.
snmp-server community mycommunity ROConfigure Cacti to Monitor a Network Devices
After configuring you device to allow SNMP polling you need to add your router to cacti so you can graph your network bandwidth. Once that is done you will need to add the new box as a device on your Cacti web interface. Click Add new Devices and choose Cisco Router as host template.
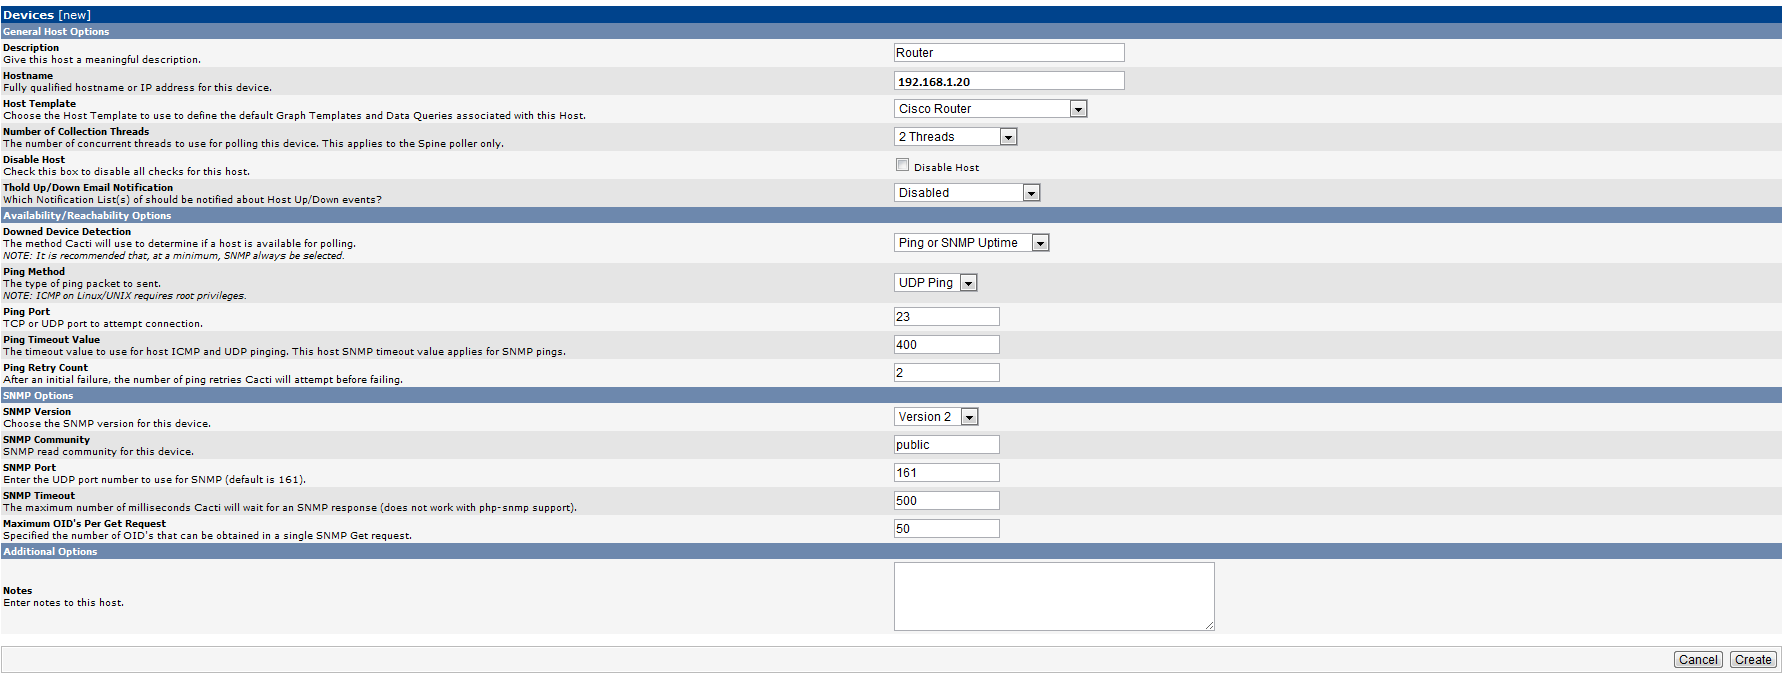
You will need to populate the fields similar to how I did above in the example:
- Description – Give your router’s name here.
- Hostname – Enter your router’s IP address or resolved hostname that cacti can use to contact your router.
- Host Template – Choose the appropriate template for your router. Most routers will work just fine with the “ucd/net SNMP Host” template. However, if your router is a Cisco, you can use the built in “Cisco Router” template that comes by default with cacti.
- Downed Device Detection – Typically any of the available options will work fine.
- SNMP Version – You will need to match this to the version that you enabled in your router. Typically versions 1 and 2 are the defaults.
- SNMP Community – Put your community string here. This is kind of a password that is used to communicate with the device.
- SNMP Port – Port 161 is the default and is more than likely what you should use here.
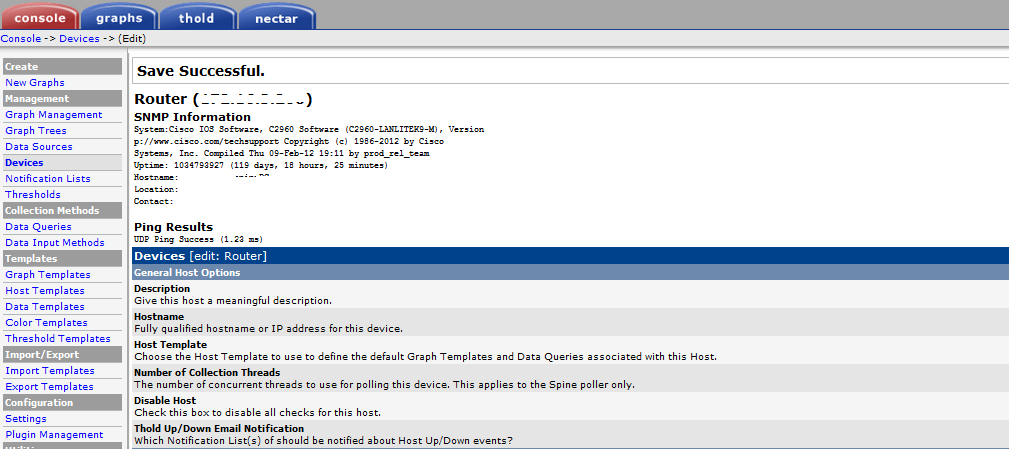
After you enter the fields above, hit the “Save” button. It should add the device to the cacti host configuration.
If the information that you entered above is correct and let cacti connect to you router , you should see the SNMP information’s as this example.
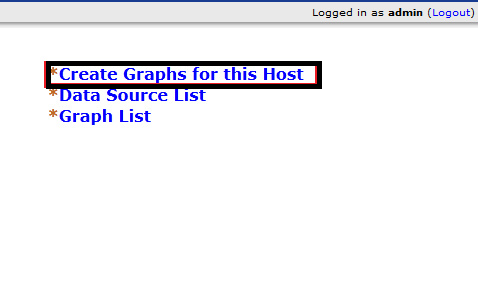
And then we proceed to creating the graphs.
You can choose from the various interfaces and other options like cpu , load that cacti found it from snmp polling. Click the ones that you want to graph and leave the others off the list. Hit the “Create” button when you are done and ready to move on.
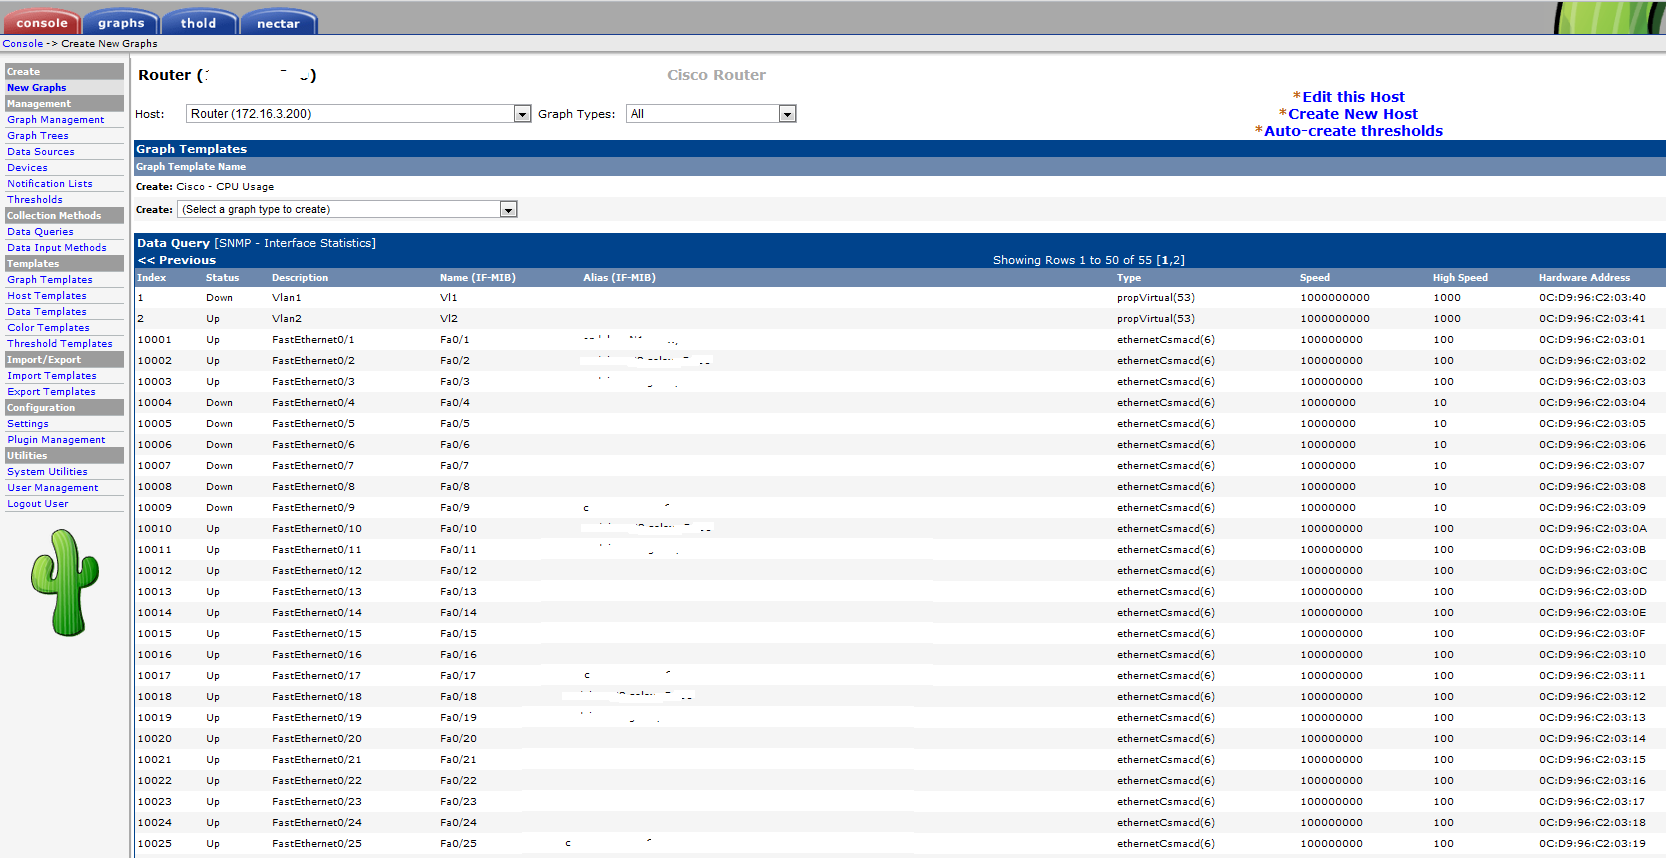
Cacti takes around 15 minutes for Cacti to populate new graphs. Go to Graph tab and Click on it should show you your device’s graphs.
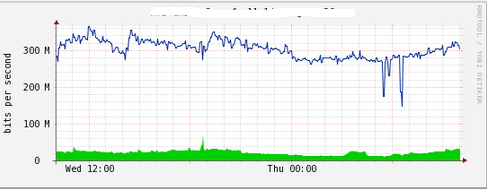
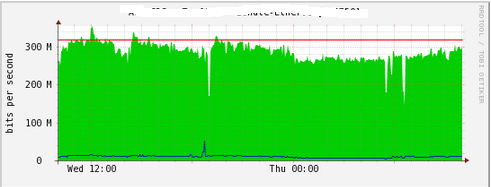
We hope that we gave you all the wanted information concerning the usage of cacti for monitoring your bandwidth in network. By the way if we missed something to add please feel free to leave a comment and give your feedback. We are always available to offer the best service for every one want to enlarge his knowledge.


