
Zabbix is an enterprise-class open source distributed monitoring solution that can be used to monitor and track performance and availability of network servers, devices and other IT resources. It supports distributed and WEB monitoring, auto-discovery, and more.
I tested this how-to On Ubuntu 15.10, although it should work on other Ubuntu distributions and it’s derivatives. For the testing purpose, I will use the following two machines.
Zabbix Server System:
- Operating system : Ubuntu 15.10 64bit edition
- Server IP Address : 192.168.1.103/24
- Hostname : server.unixmen.local
Zabbix Client System:
- Operating system : Ubuntu 14.04 LTS
- IP Address : 192.168.1.104/24
- Hostname : sk
First let us start from server side.
Prerequisites
Before installing Zabbix, we should have install and configure LAMP stack on server. To install and configure LAMP server On Ubuntu or Debian refer the following links.
Install Zabbix On Ubuntu 15.10 server
After installing LAMP stack, let us add the Zabbix repository to our Ubuntu
Zabbix is available in Ubuntu default repositories, however it might be bit outdated. So let us install most recent version from the official Zabbix repositories. At the time of writing this tutorial, the latest version was Zabbix 2.4.
Or you can download and add the repository as shown below.
sudo wget http://repo.zabbix.com/zabbix/2.4/ubuntu/pool/main/z/zabbix-release/zabbix-release_2.4-1+trusty_all.deb
sudo dpkg -i zabbix-release_2.4-1+trusty_all.deb
Now update package lists and Zabbix server using commands:
sudo apt-get update
sudo apt-get install zabbix-server-mysql zabbix-frontend-php
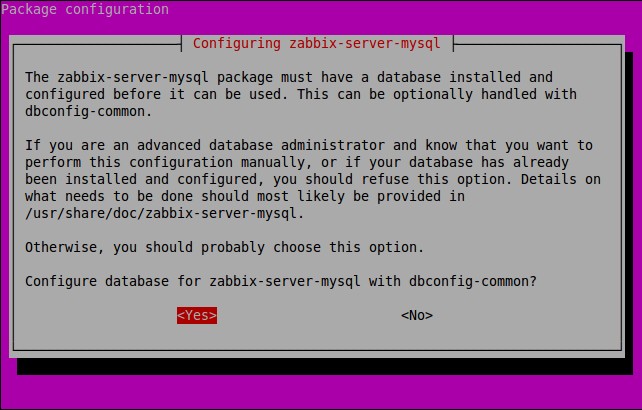
During installation, you’ll be asked to answer couple of questions regarding database configuration.
Select Yes and press enter to configure database for Zabbix.
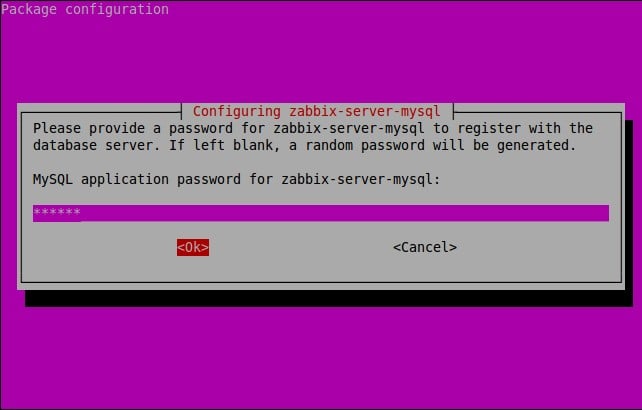
Provide a password for Zabbix to register with the MySQL database server.
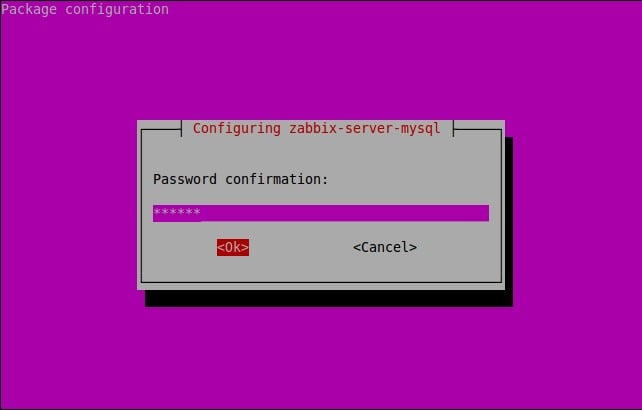
Re-enter the password.
Enter the MySQL administrative account ‘root’ user password.
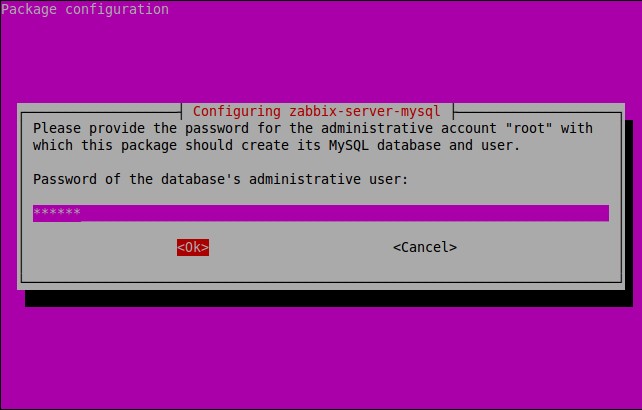
During installation, a new database called ‘zabbix’ will be created along with user ‘zabbix’.
After successfully installing Zabbix let us adjust some PHP settings for zabbix front-end.
To do that, edit file /etc/apache2/conf.d/zabbix,
sudo nano /etc/apache2/conf-available/zabbix.conf
Find the following lines and edit them as follows. If the lines doesn’t exists, add them.
[...]
php_value max_execution_time 300
php_value memory_limit 128M
php_value post_max_size 16M
php_value upload_max_filesize 2M
php_value max_input_time 300
php_value date.timezone Asia/Kolkata
[...]
It is mandatory, to adjust the correct time zone for you. Save and close the file.
Edit php.ini file,
sudo nano /etc/php5/apache2/php.ini
Find the following line and modify it from:
;always_populate_raw_post_data = -1
to (just take the quotes off):
always_populate_raw_post_data = -1
Save and close the file.
Restart apache2 service to apply the changes.
sudo systemctl restart apache2
Access Zabbix Web Console
Open web browser and access the zabbix web console with URL: http://ip-address/zabbix or http://domain-name/zabbix.
Click Next to continue:
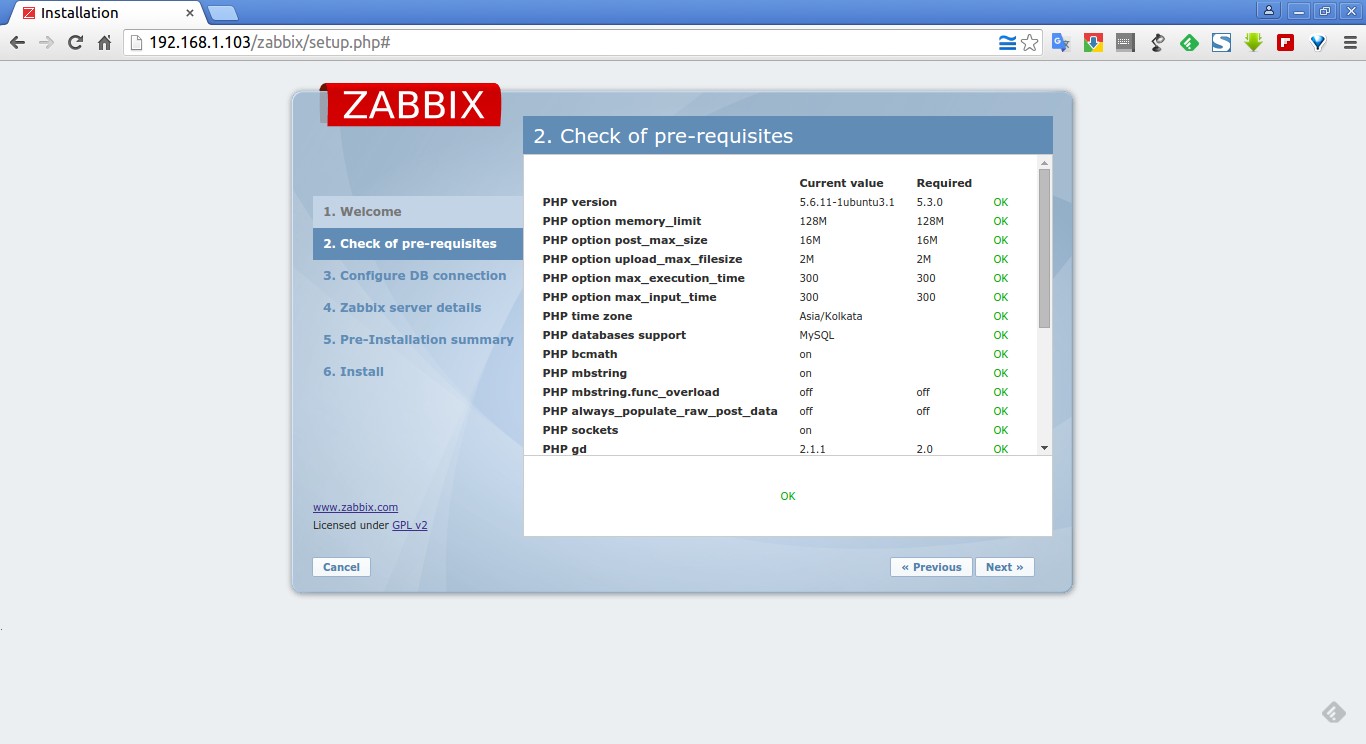
It will check all prerequisites. If everything OK, click Next to continue.
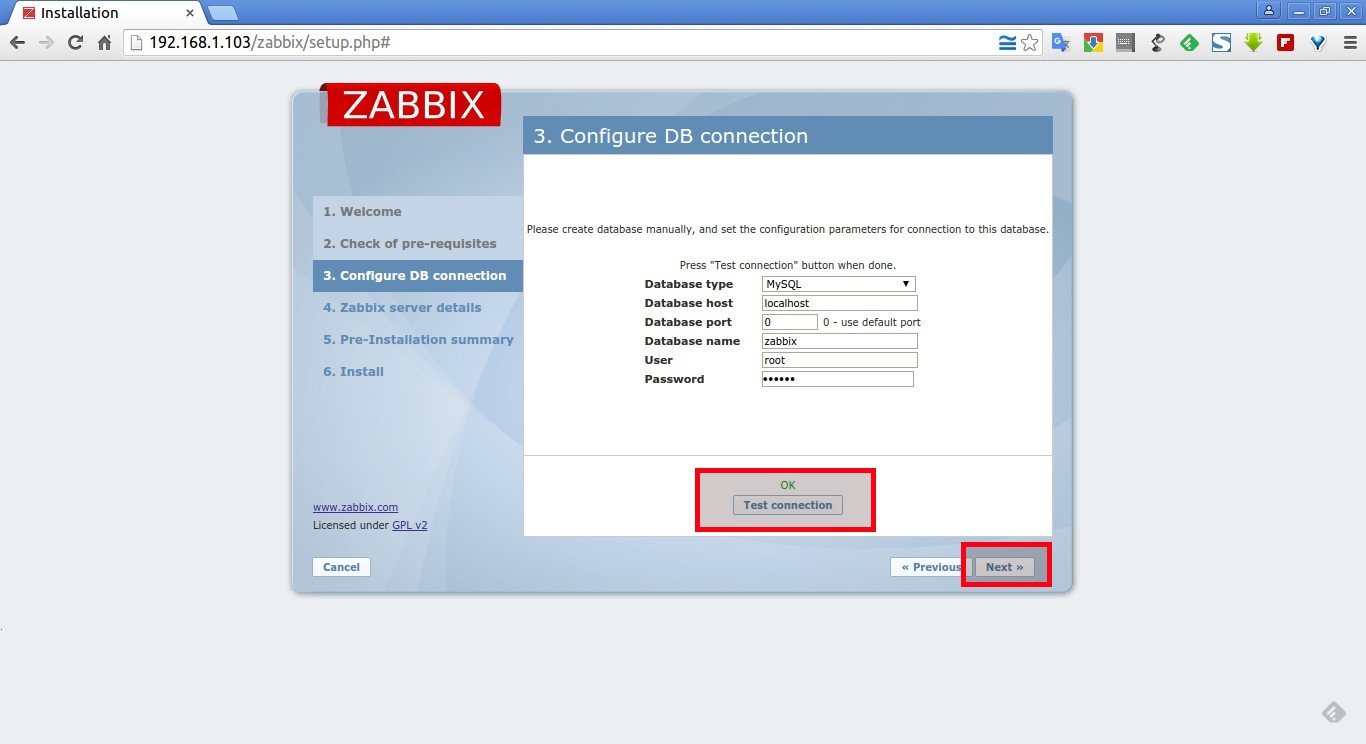
Next enter the mysql administrative password and click Test connection. The database called ‘zabbix’ will be created automatically during the installation. If it says Ok, click Next to continue.
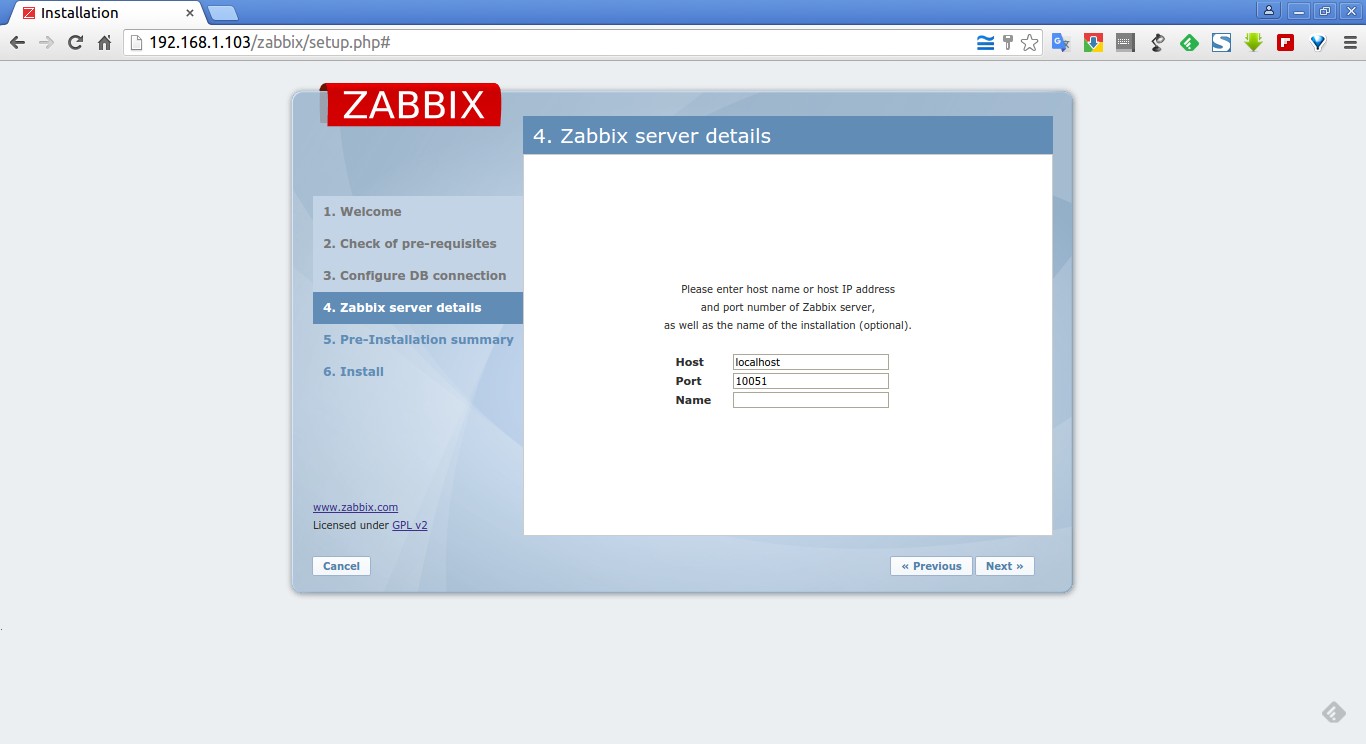
Click next:
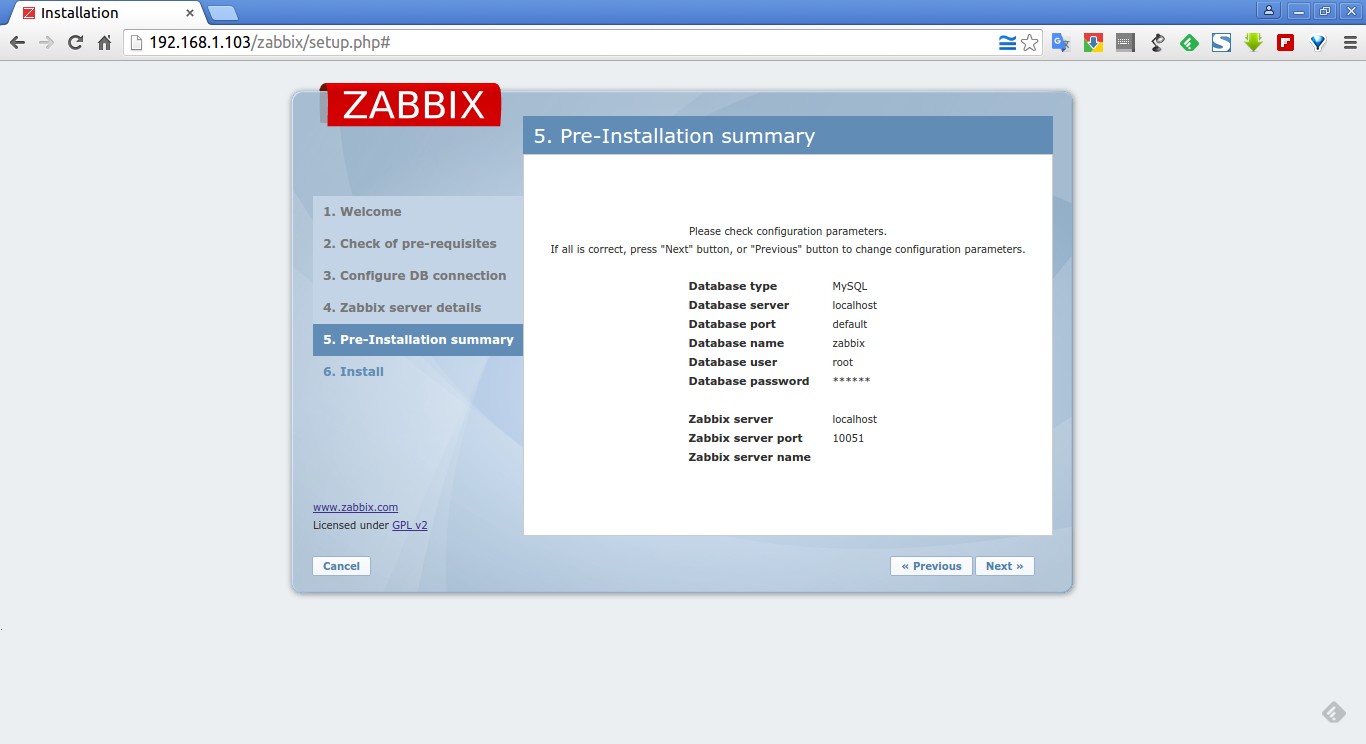
Check configuration parameters once again and click Next to continue if all correct. If you want to change anything, just hit Previous button and do the changes.
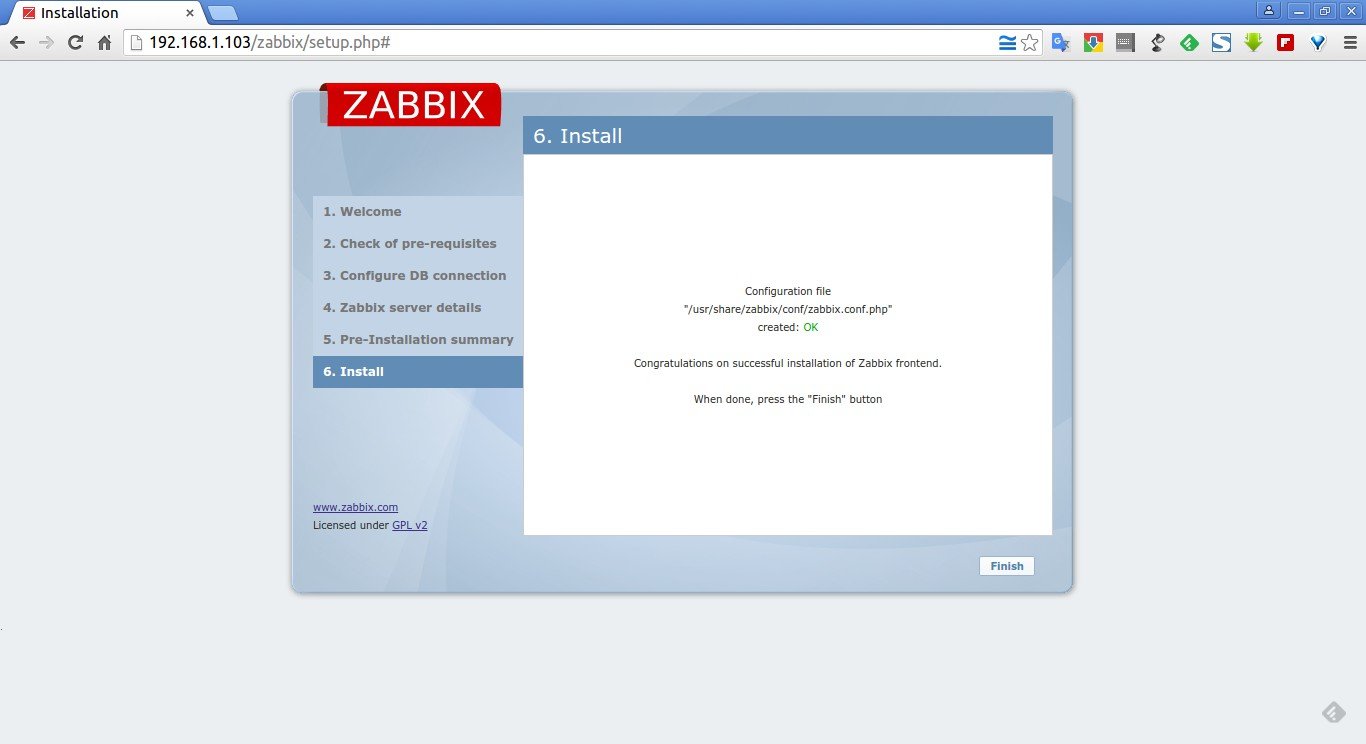
Click Finish to complete the installation.
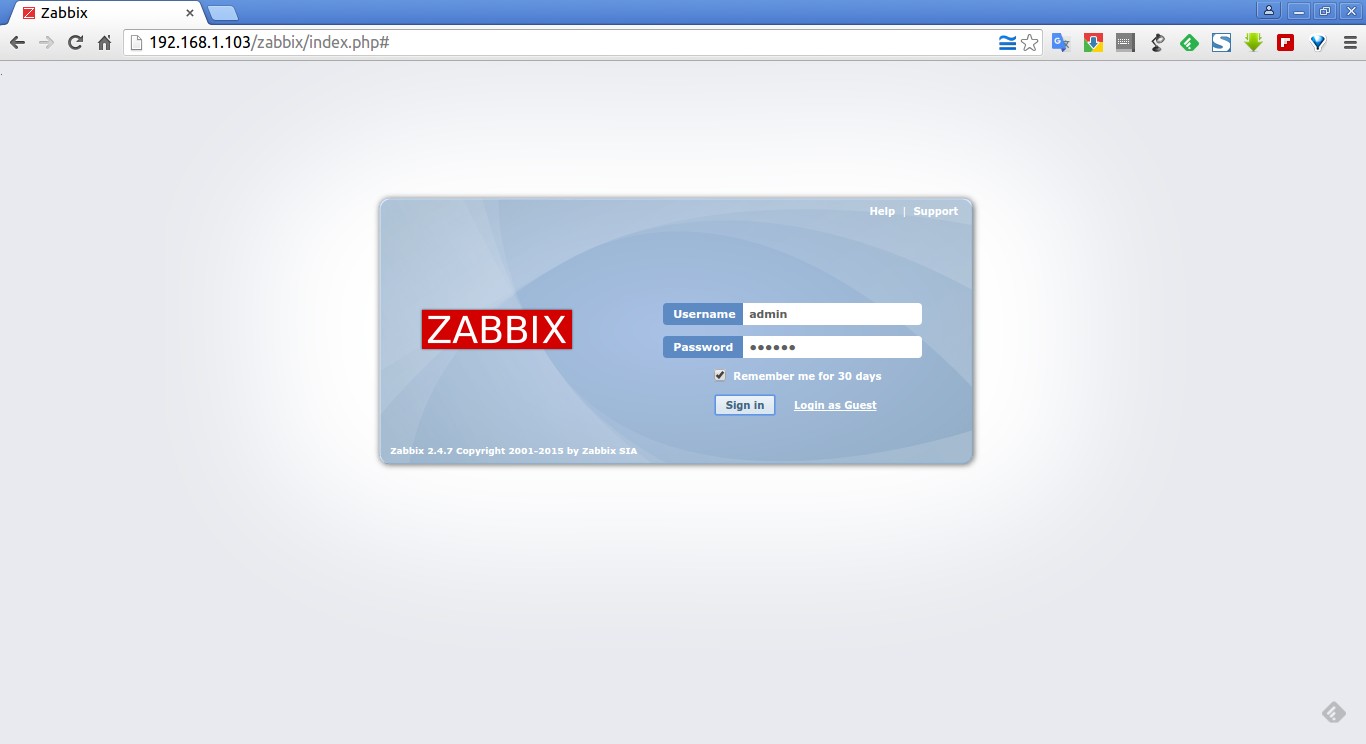
Now you’ll be asked to enter the username and password. The default username/password is admin/zabbix.
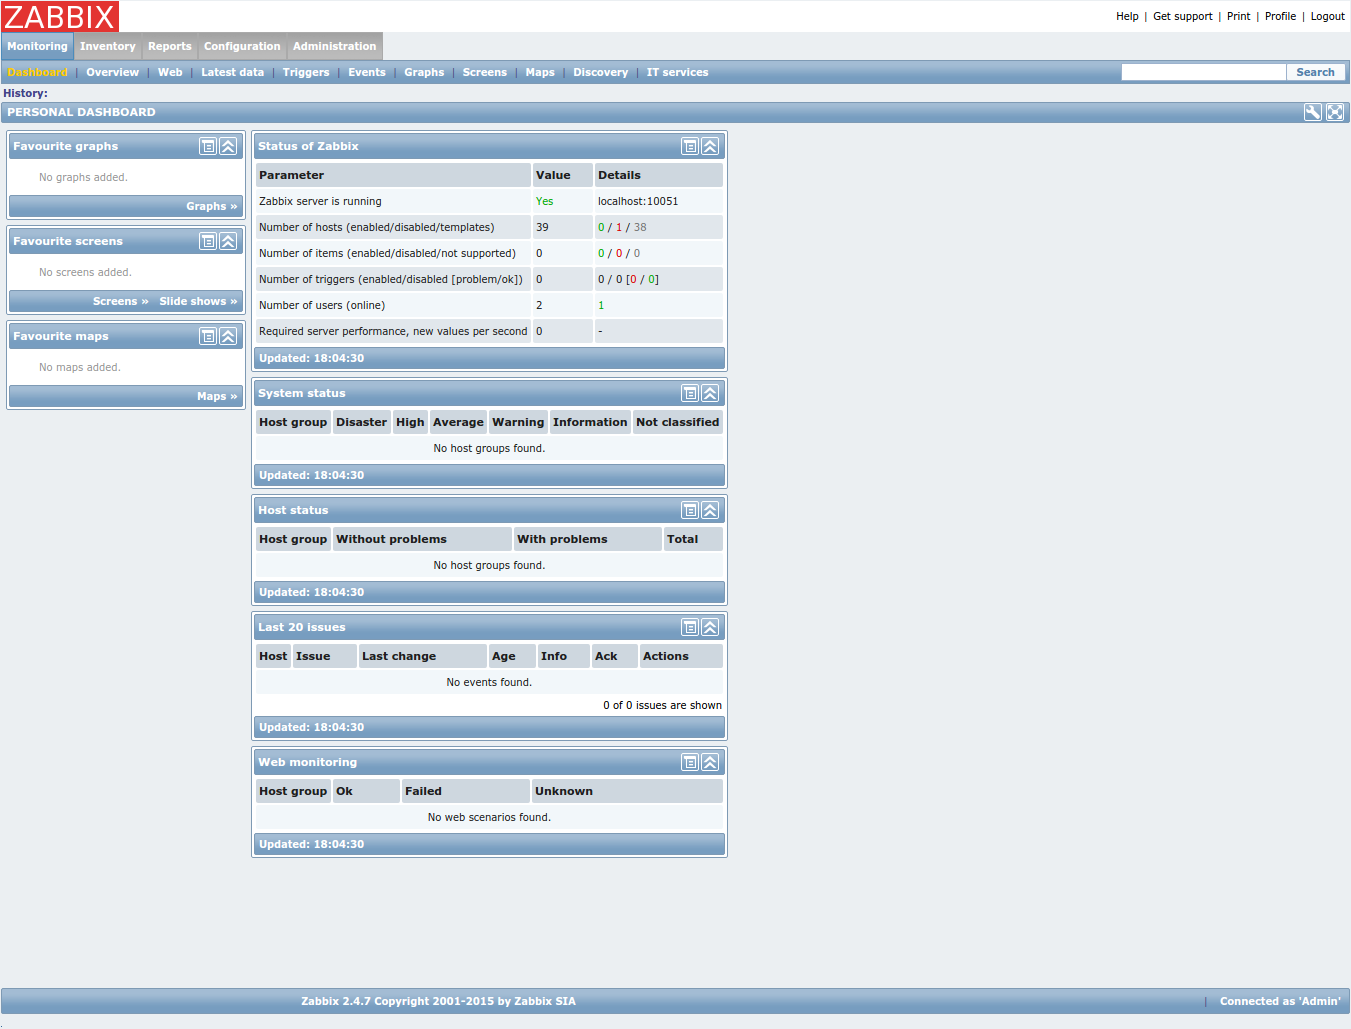
Congratulations! You’ve completed the zabbix server and front-end installation successfully.
Here it is how my zabbix server Dashboard looks like.
Install zabbix-agent On zabbix server
zabbix agent is used to send the reports to the server. Let us install this package on our server with following command:
sudo apt-get install zabbix-agent
At the server side you don’t have to configure agent, default values will work just fine.
Now go to the Dashboard and navigate to Configuration tab on the tab menu bar. Click on the Hosts tab. You’ll see that the zabbix server has been listed there.
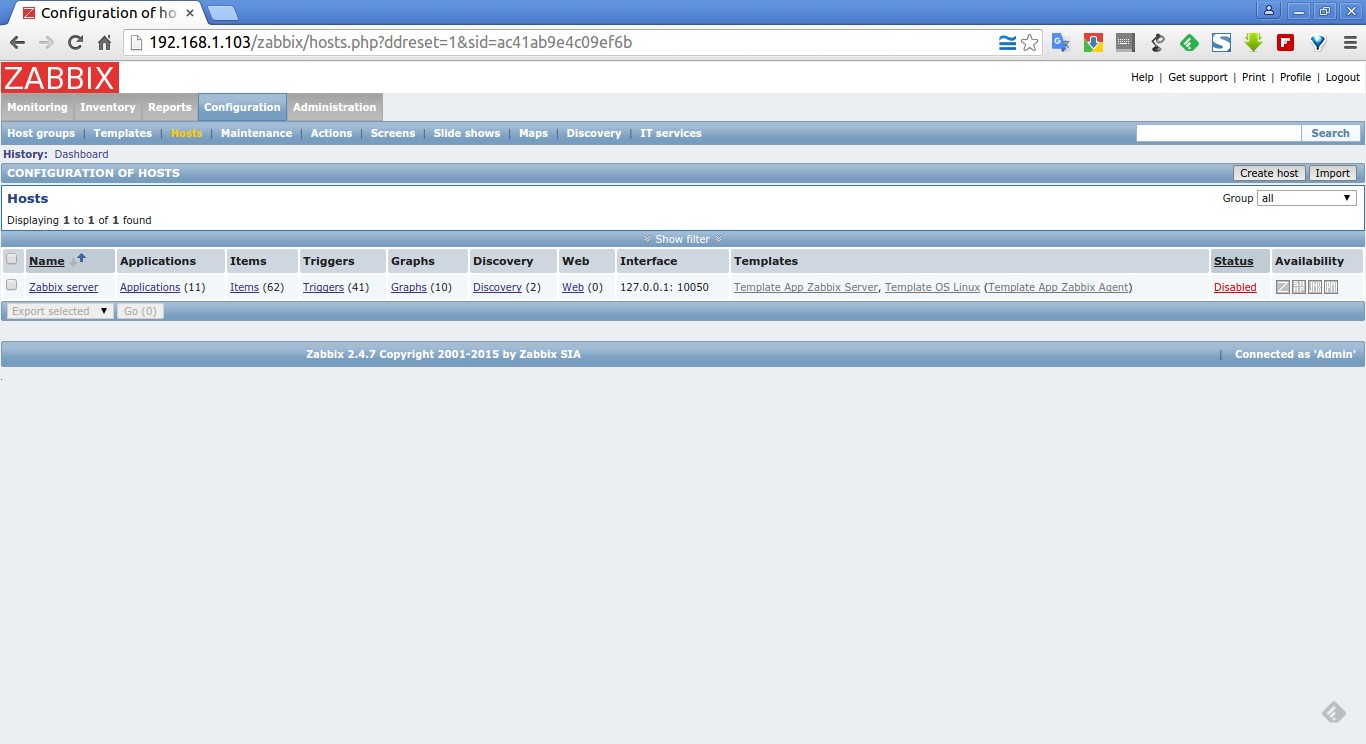
Initially, the zabbix server will not monitor itself. You have to enable it manually to monitor itself.
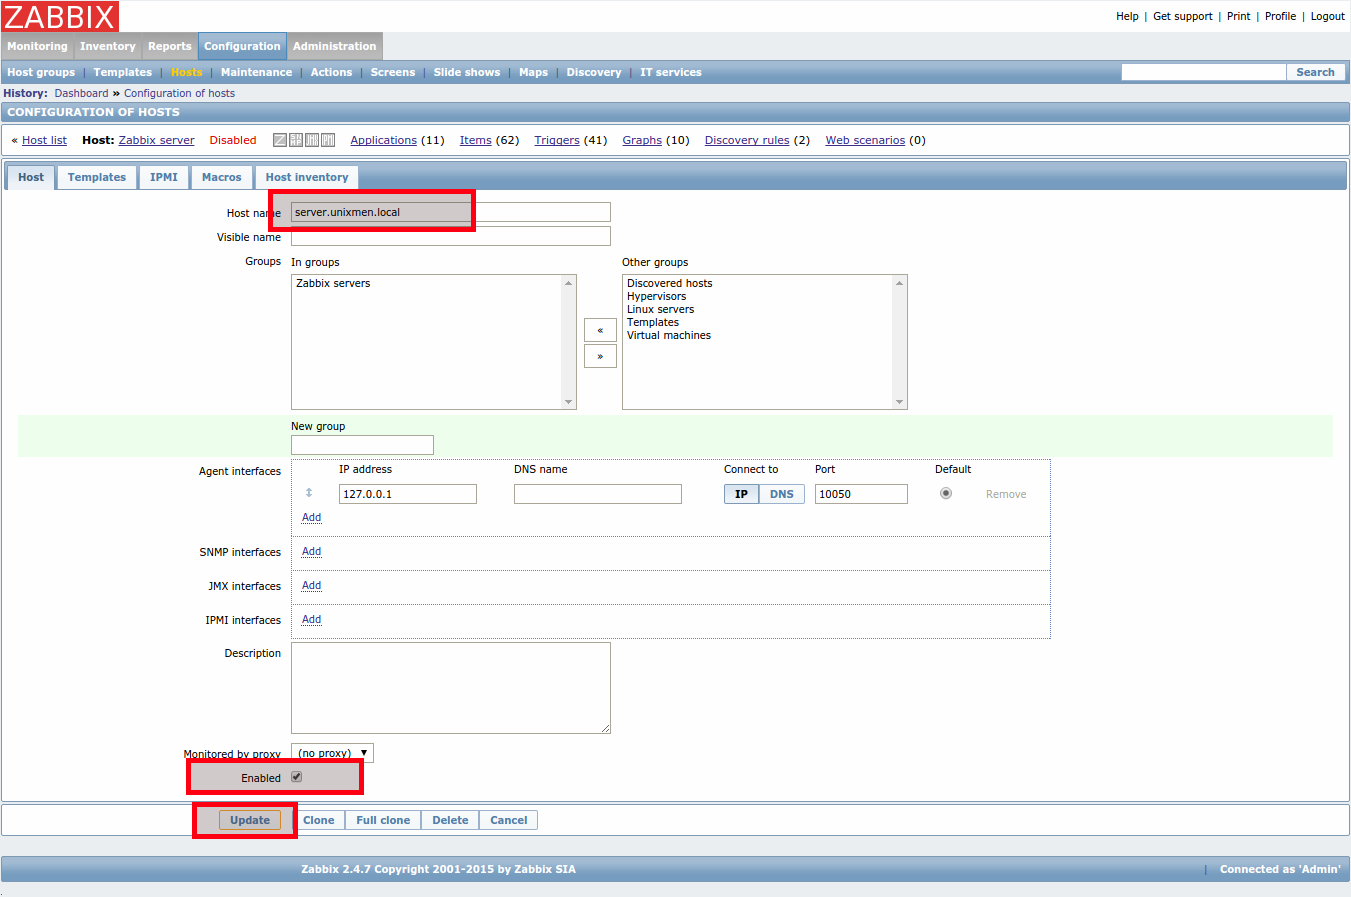
Click on the name of the server and set host name, and check the box that says “Enabled” at the bottom and click Update button. Refer the screenshot.
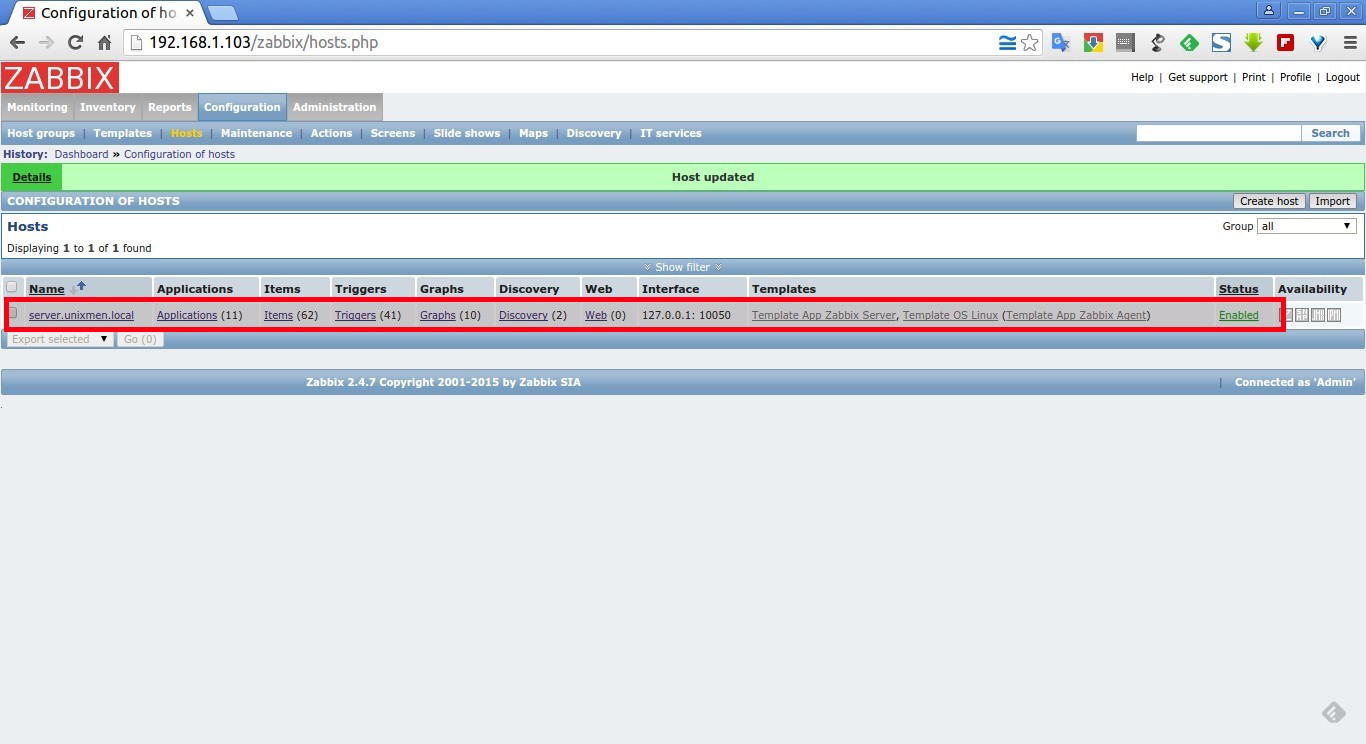
Wait for few minutes and you’ll see the zabbix server status will be changed to Enabled.
Zabbix Client Side Configuration
Install zabbix-agent package in your client system:
sudo apt-get install zabbix-agent
Next edit file /etc/zabbix/zabbix_agentd.conf,
sudo vi /etc/zabbix/zabbix_agentd.conf
Add the server ip address and client hostname.
[...]
Server=192.168.1.103
[...]
Hostname=sk
[...]
Where,
- 192.168.1.103 – Ubuntu 15.10 server’s IP address (Zabbix server).
- sk – Ubuntu 14.04 hostname (Zabbix client hostname).
Now restart zabbix-agent service with command:
sudo service zabbix-agent restart
Add Monitoring host – Method 1
Next go to the zabbix server’s Dashboard.
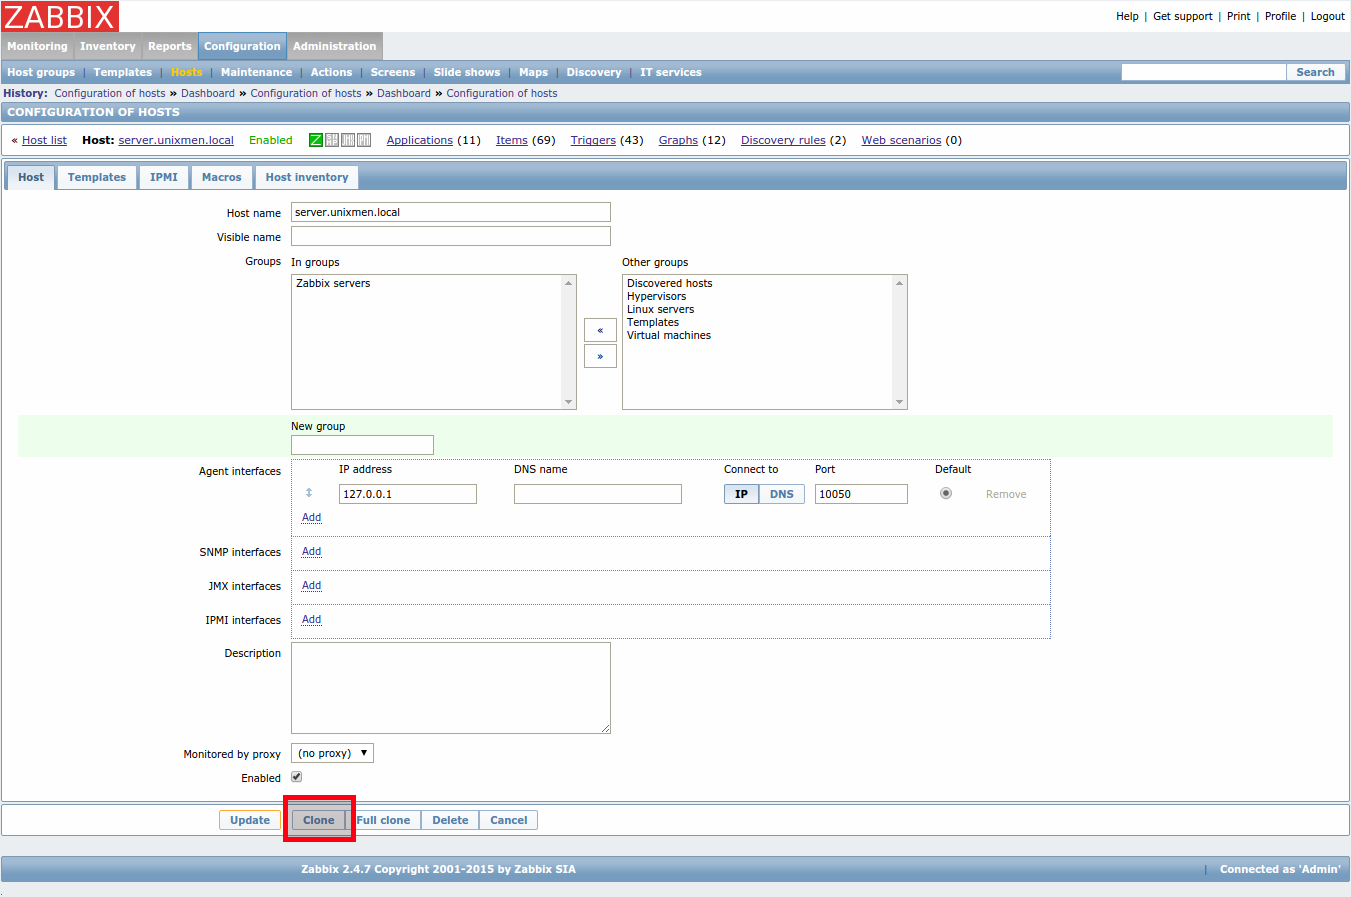
Navigate to Configuration -> Hosts and click on your Zabbix server name.
Click the Clone button at the bottom. Refer the following screenshot.
Enter the client hostname, select the group type, and enter IP address etc. Finally click Add. Don’t forget to check the box that says: Enabled above the Add button.
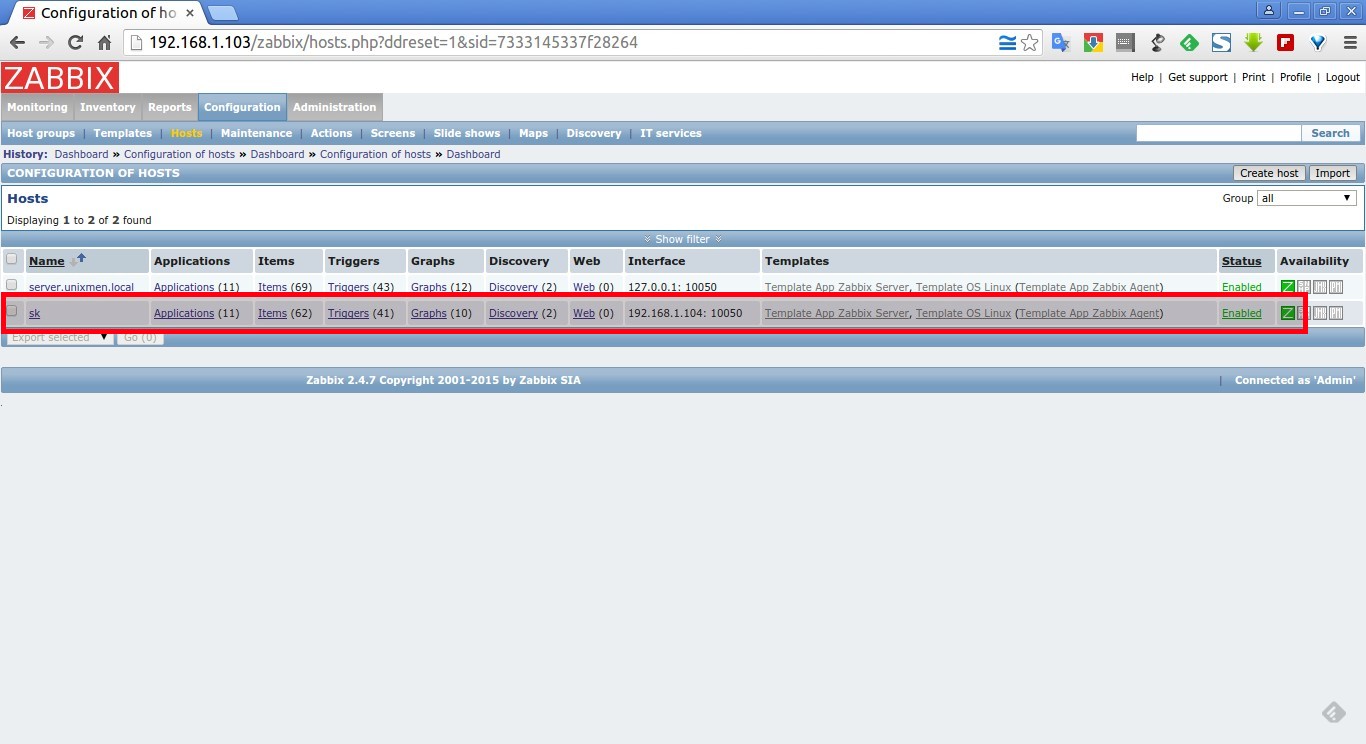
Now you’ll see that the client is added to monitoring list.
Add Monitoring Host – Method 2
From the Dashboard, go to Configuration -> Hosts. Click on Create host on the right side.
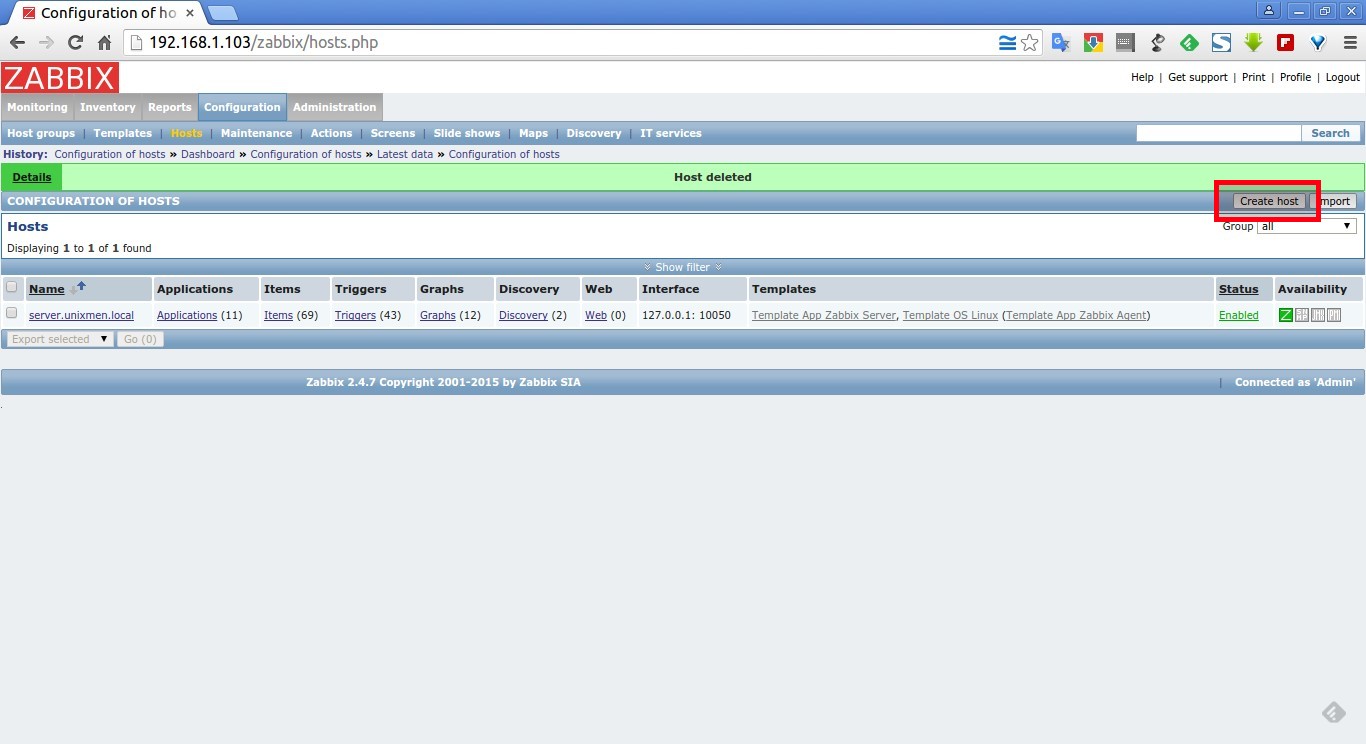
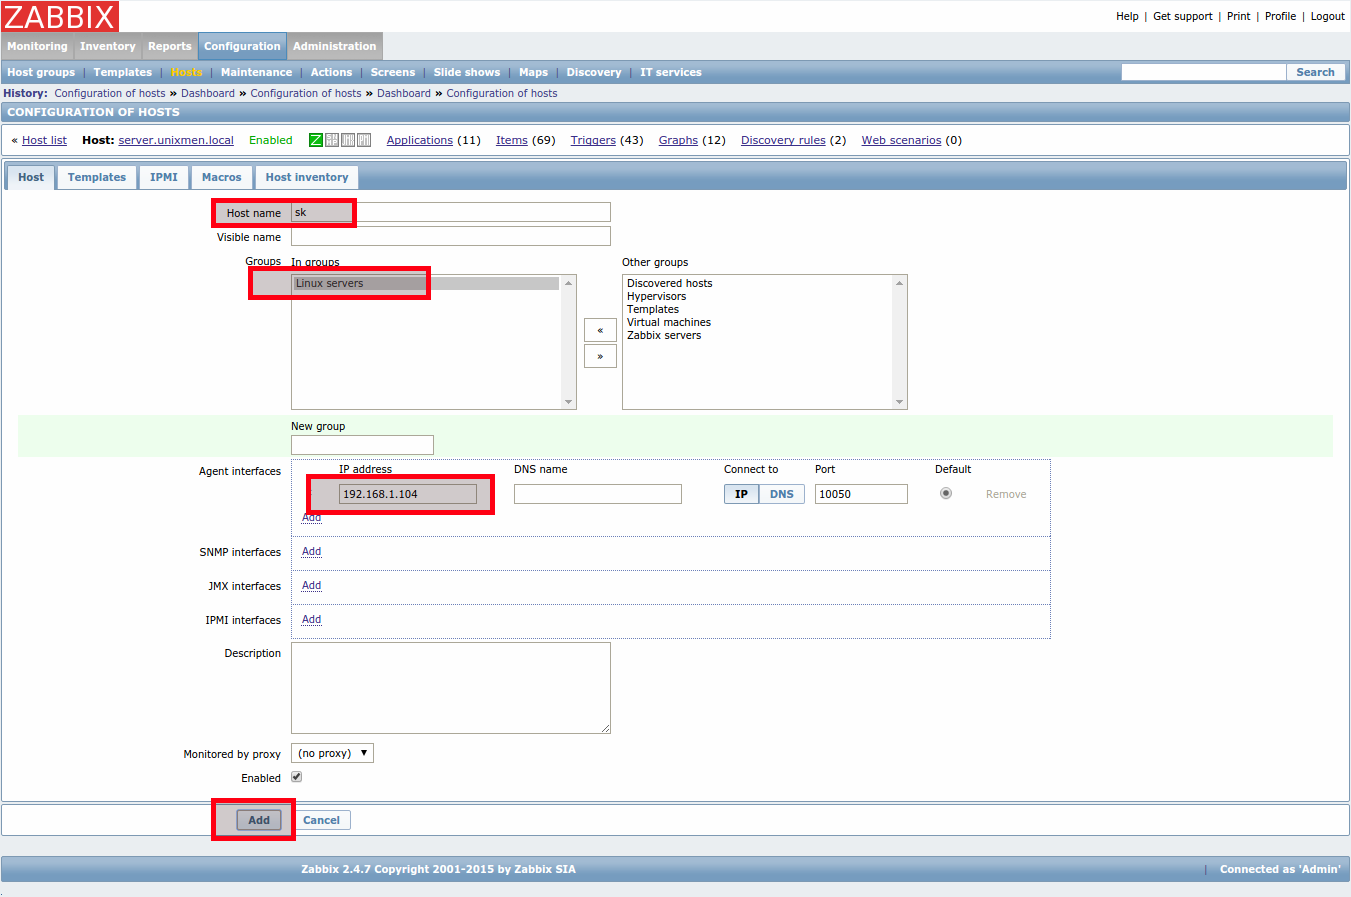
Enter hostname, select Groups and enter IP address as shown below and click Add.
Next go to Templates section and click Select button to choose template depending upon the type of your Host.
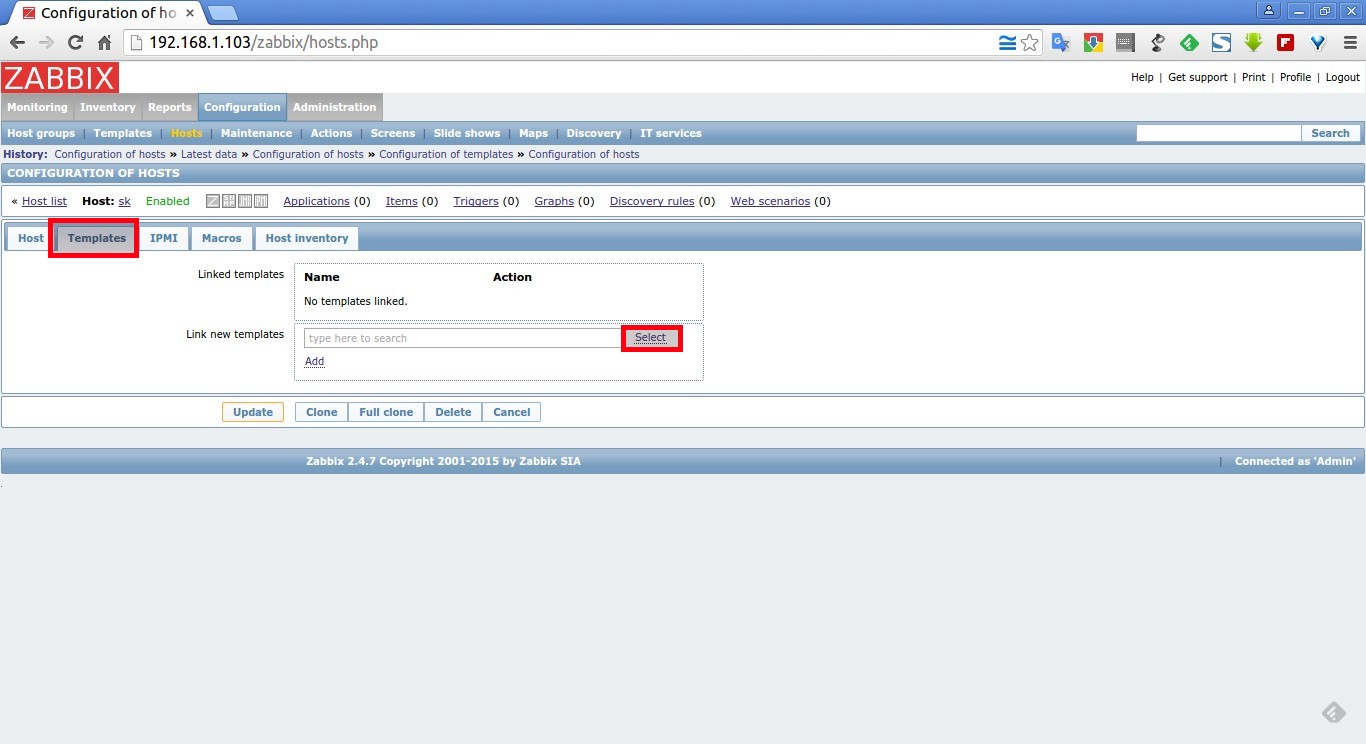
Hence my Zabbix client is Ubuntu desktop, So I have selected Template OS Linux. Then click Select.
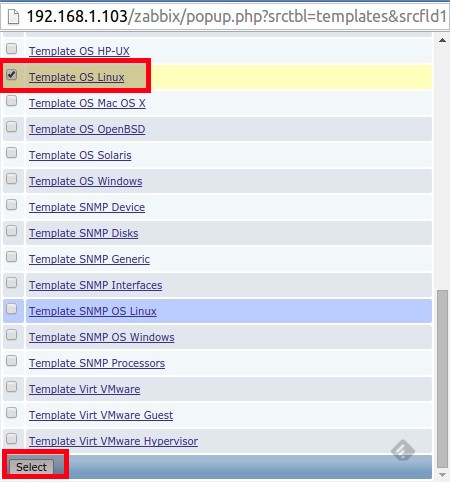
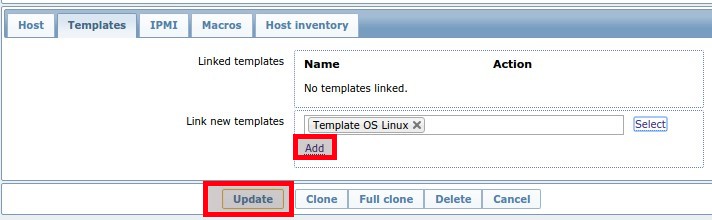
After selecting the templates of your choice, click Add button followed by Update button.
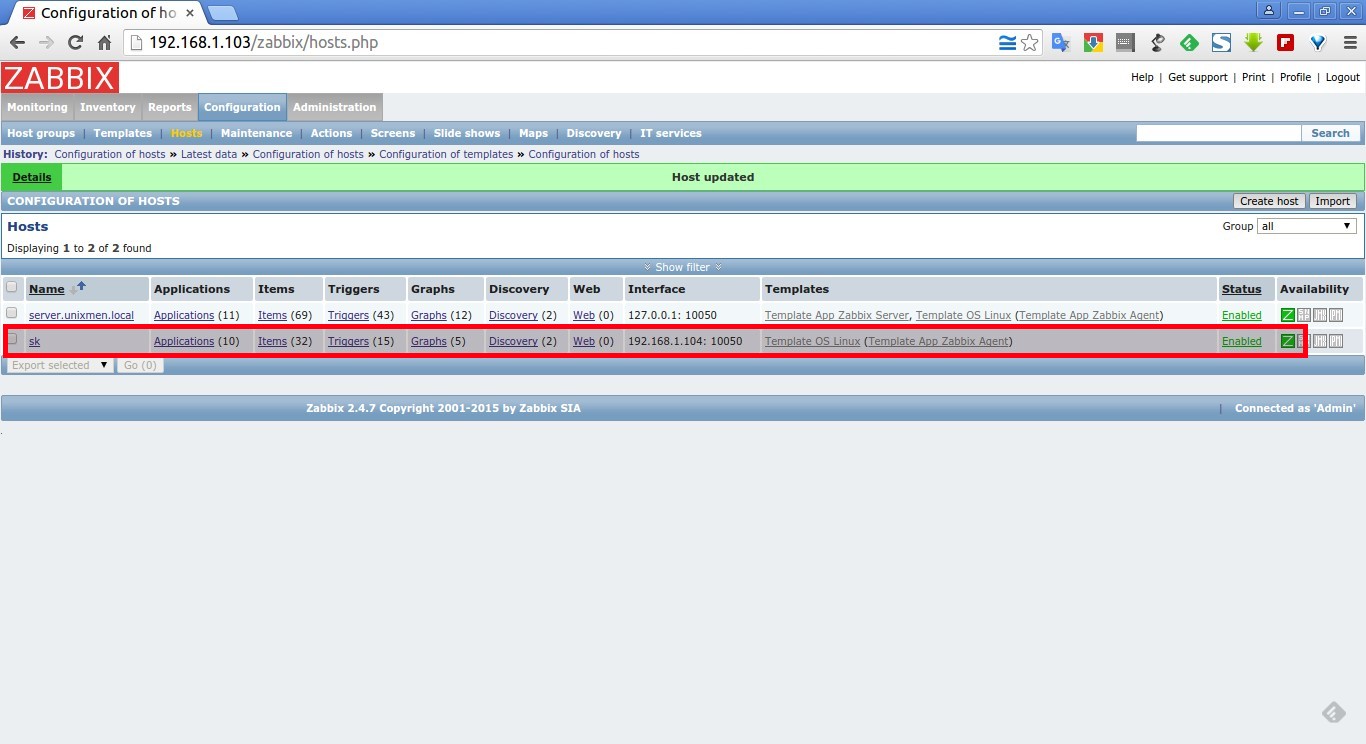
Now the client will be added in the Hosts list.
That’s it. Happy monitoring!!
Links:


