
There are some tools which we must know as Linux/Server Admin to monitor the health/performance status of any running Server. Generally we have to monitor health/status of RAM, CPU, I/O Devices and Network. Our demo is performed with Ubuntu Server 14.04. There are many System Performance Monitoring Tools For Linux, but these are the often used tools.
Let us have a look.
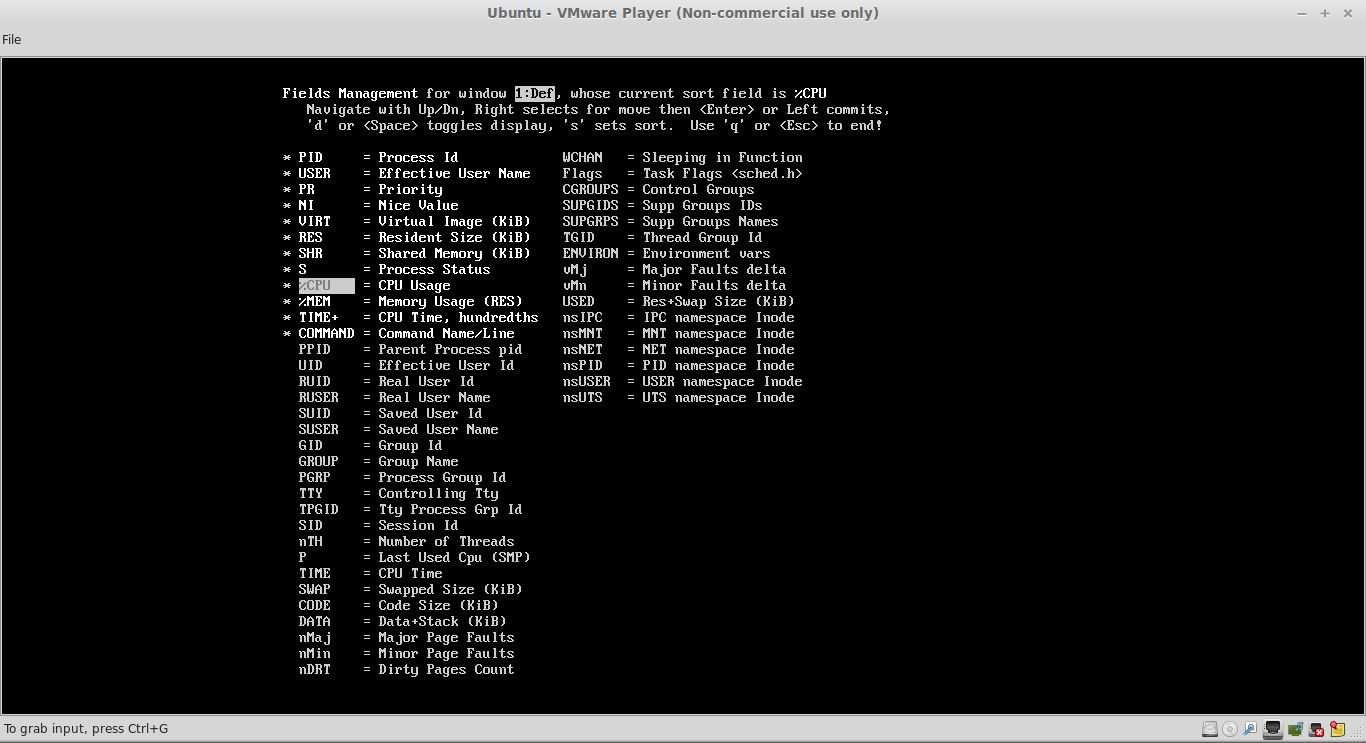
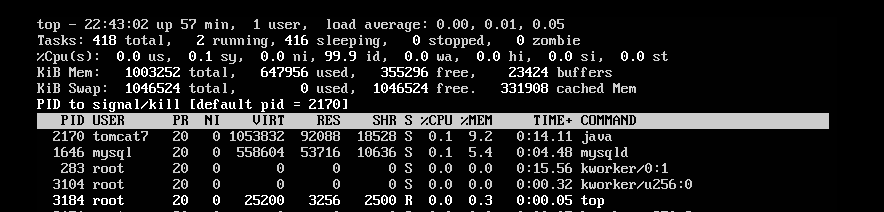
1. TOP
A very important tools for all Linux users, This command displays activities of CPU and RAM in Real Time.
top
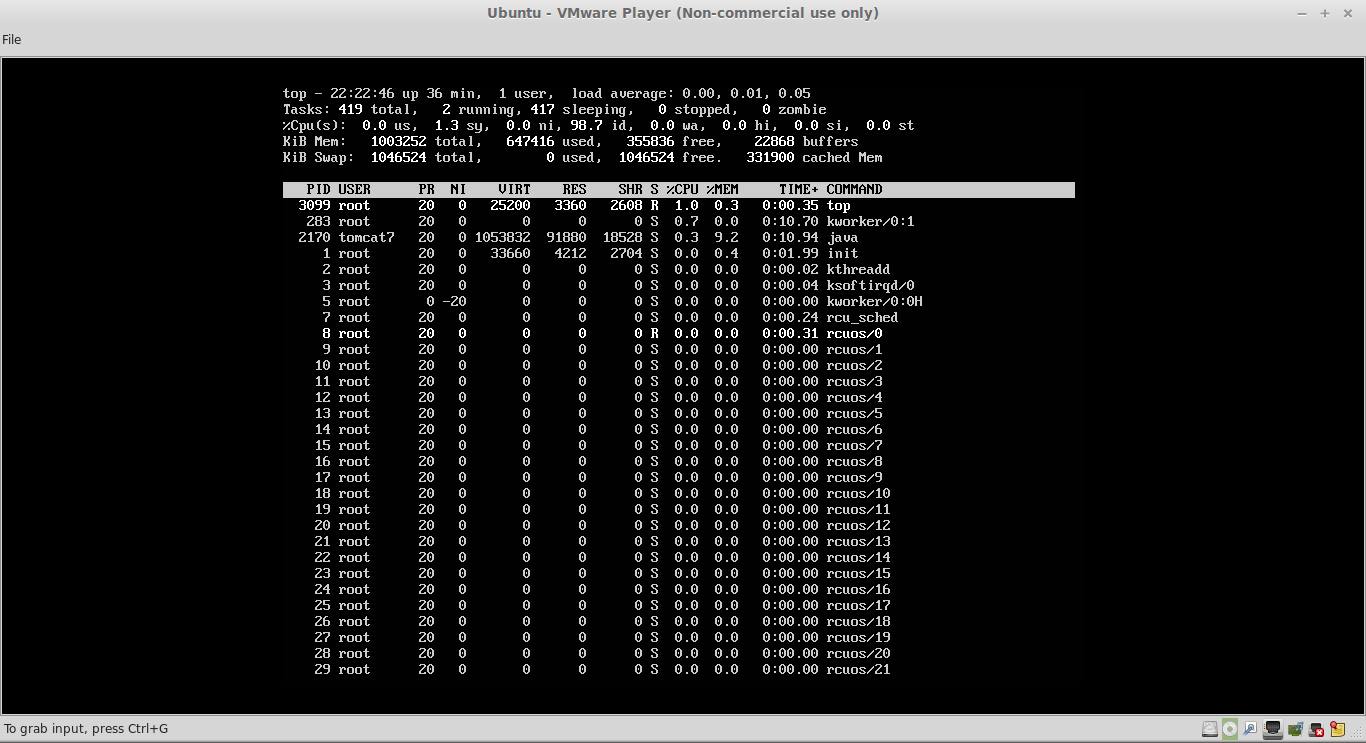
List of process are displayed by default on CPU utilization bases, press “<” or “>”to change parameters, you can use “z” key to get the colorful display so that you can monitor processes easily.
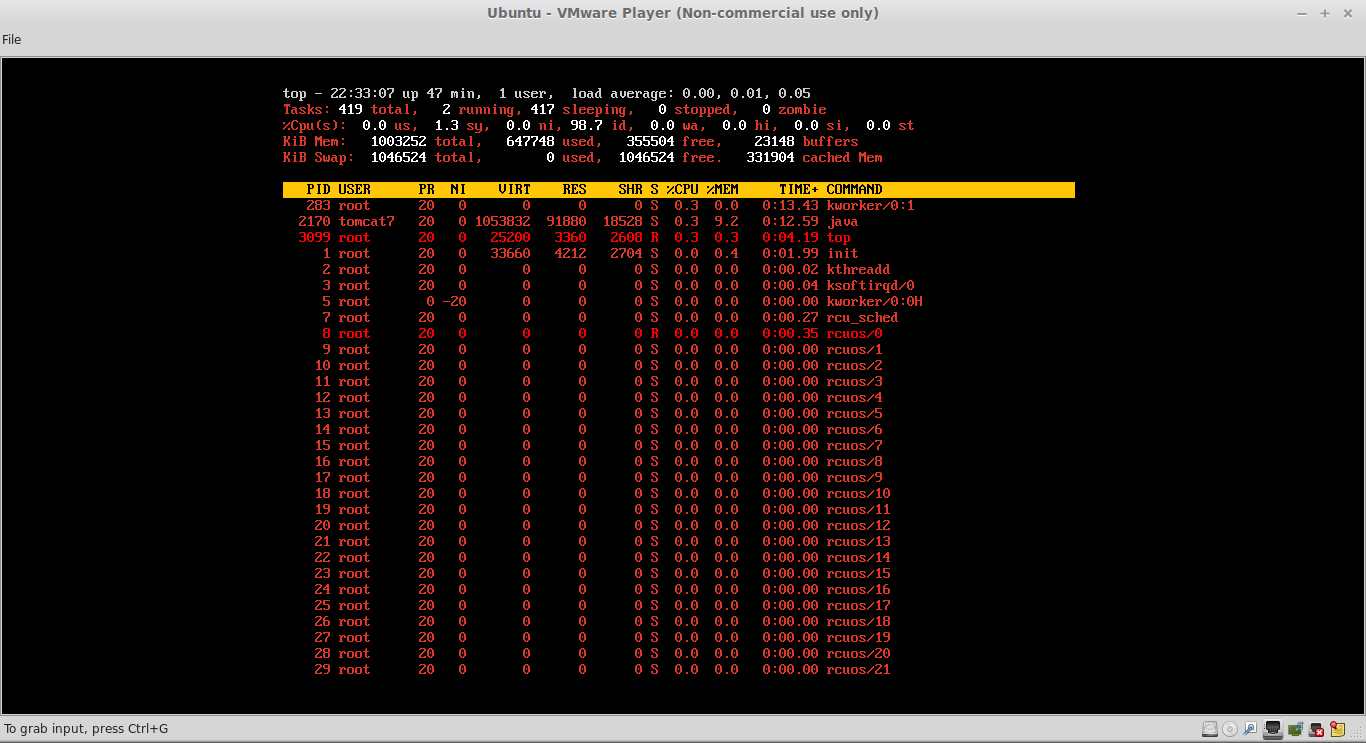
Pressing of “f” key can toggle parameters you wants to include in the output of “top” command.
Even you can kill any running process with pressing “k”, give the desired PID argument to kill concerned process.
2. IOSTAT
iostat is a very important performance analysis command used to get I/O Devices, CPU and Network based statistics.
iostat
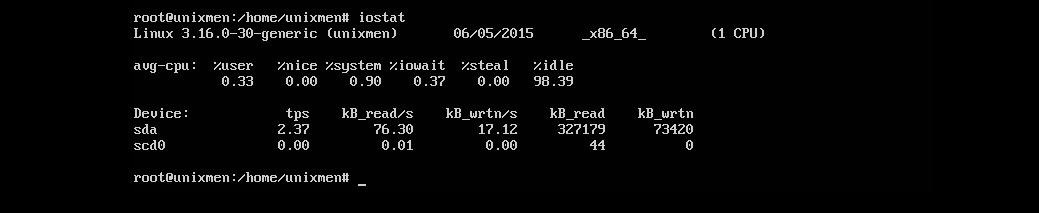
In output,
- tps – transition per second
- kB_read – data read per second in kB
- kB_wrtn – Data Write per second in kB.
Have a look in your display which device is most active and performing batter.
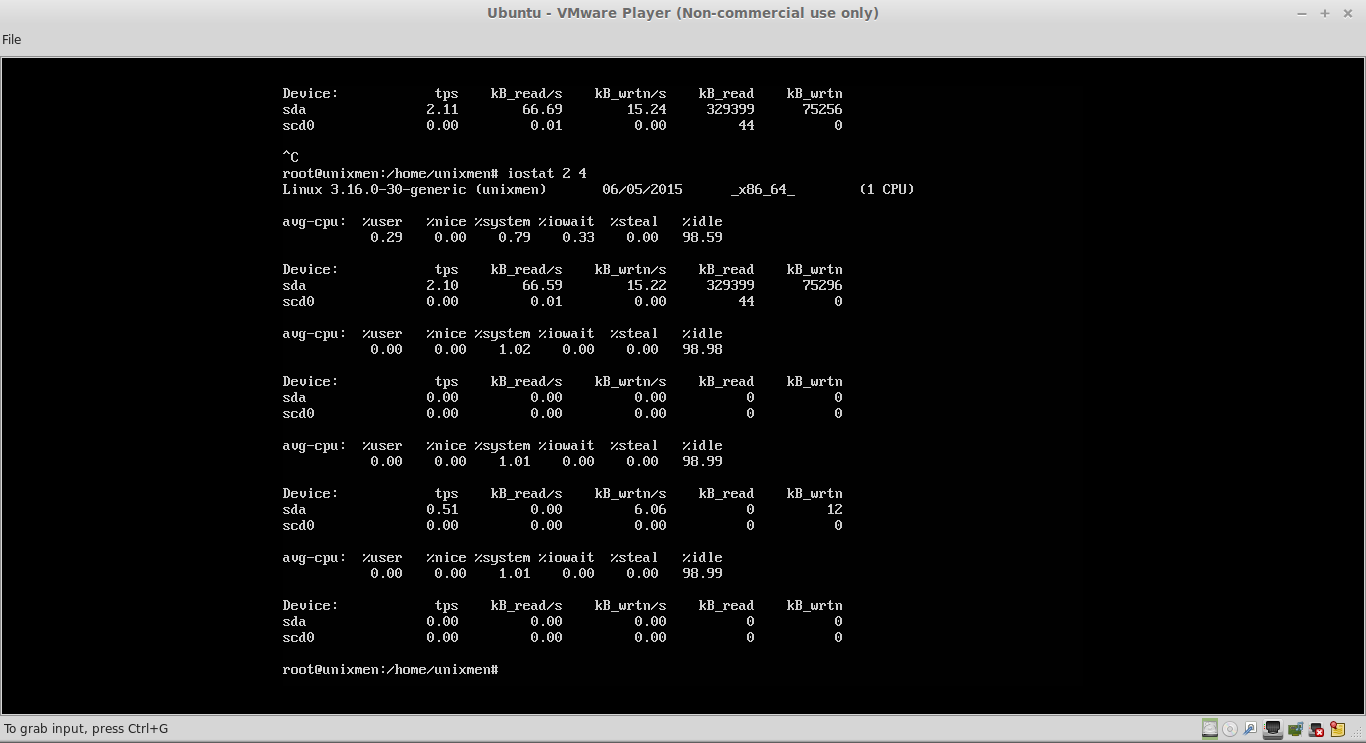
iostat 2 4
This command will display I/O Status 4 times after interval of every 2 seconds.
iostat -c
It will display only cpu statistics.

3. IOTOP
Well, I have to install that utility, in most cases this utility is not available by default. This utility displace I/O Stastics consumed per process, let’s have a look.
apt-get install iotop && iotop
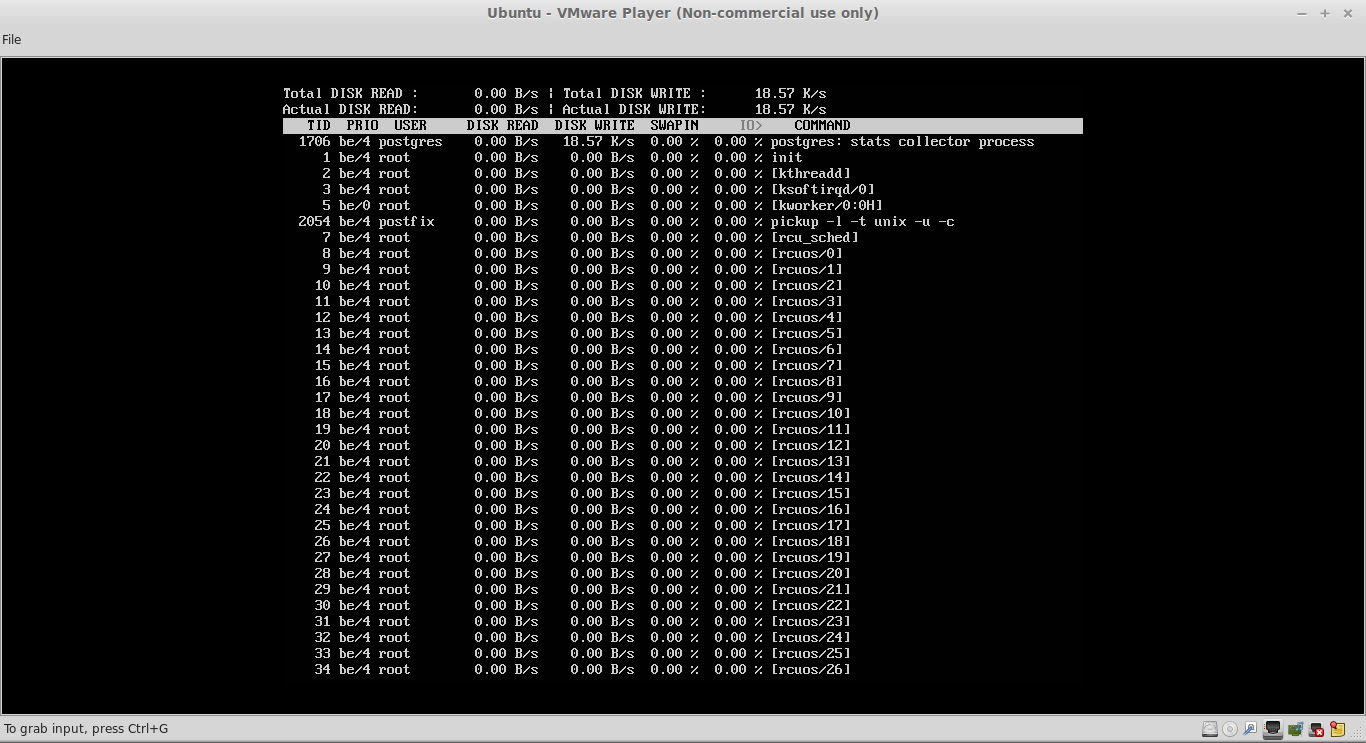
Let’s have some example- have a look in above snapshot that postgres has been listed as top most process, let’s perform some task.
dd if=dev/sda of=dev/zero&
iotop
You will observer that above process is consuming maximum I/O resources.
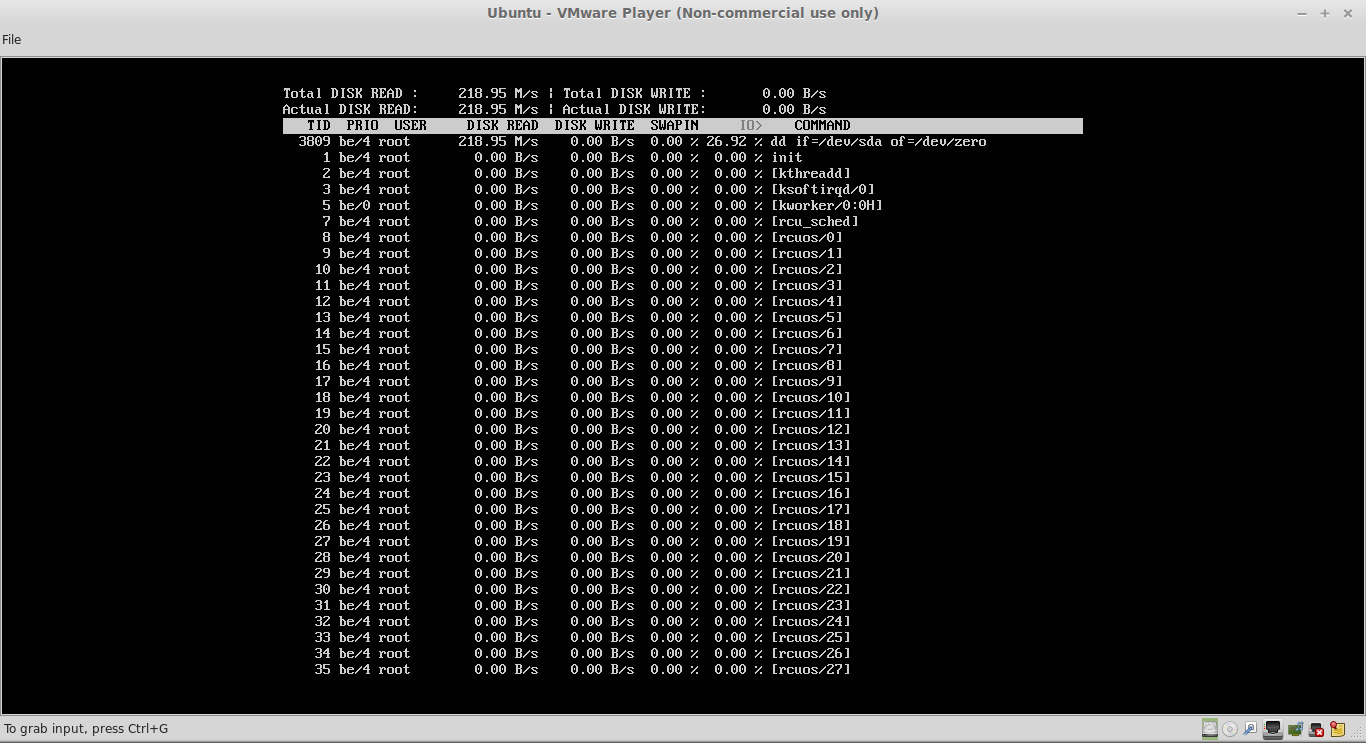
Don’t forget to kiil dd command after your testing is done!
killall dd
4. VMSTAT
Virtual Memory Status, Displays information about memory status, it comes with sysstat utility.
apt-get install sysstat && vmstat
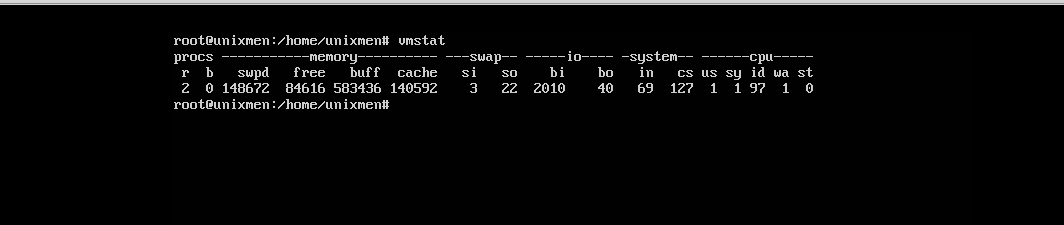
in output,
- si – swam in
- so – swap out
- bi – block in (Data reading speed)
- bo – block out (data writing speed)
It’s a very useful tool to get information about swap memory of the system.
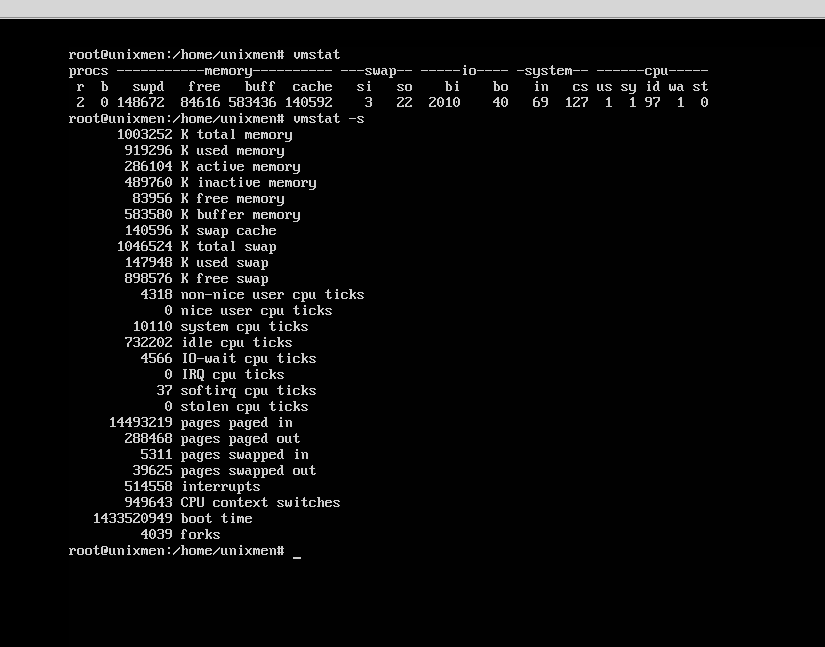
vmstat -s
This command provides detailed memory status.
5. SAR
System Activity Report comes with sysstat utility. This tool is very important because it stores the information in history from some specific time period. sar data is generated through cron jobs in /etc/cron.d/sysstat.
cat /etc/cron.d/sysstat
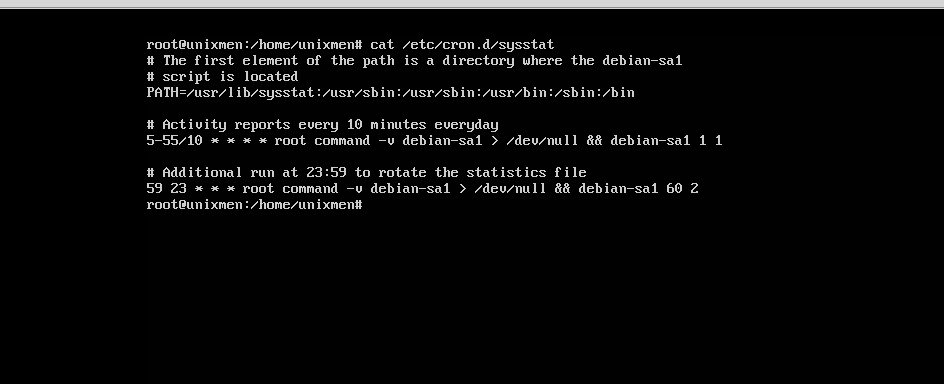
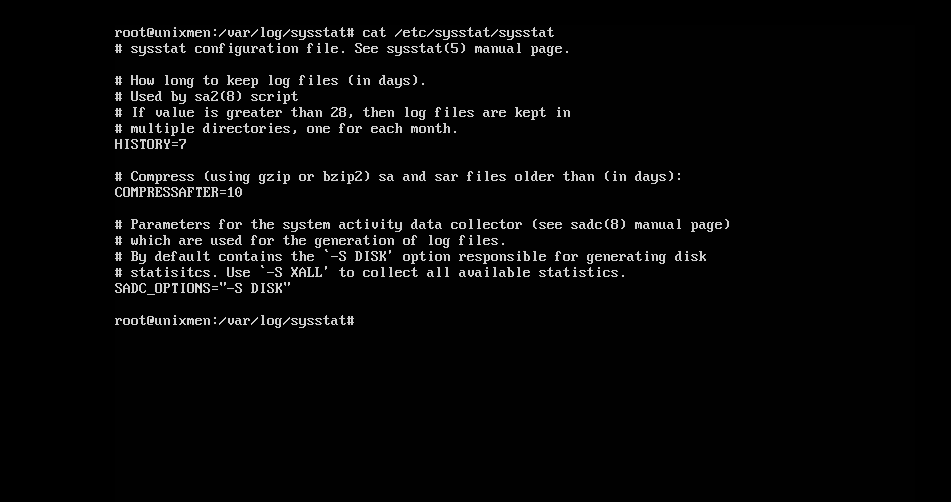
This cron job collects data every 10 minute/day then it collects data for long term record once in the midnight of every day and data is written in /var/log/sysstat/sa. Now, sar utility is used to read /var/log/sysstat/sa data.Additionally, history parameters are stored in /etc/sysstat/sysstat file in ubuntu.
cat /etc/sysstat/sysstat
‘-A’ option will display a very detailed information about I/O Devices, CPU, Memory and Network stats.
sar -A
‘-d’ option will print I/O devices status.
sar -d
‘-q’ option will display cpu average load.
sar -q
‘-S’ option will display swap status.
sar -S
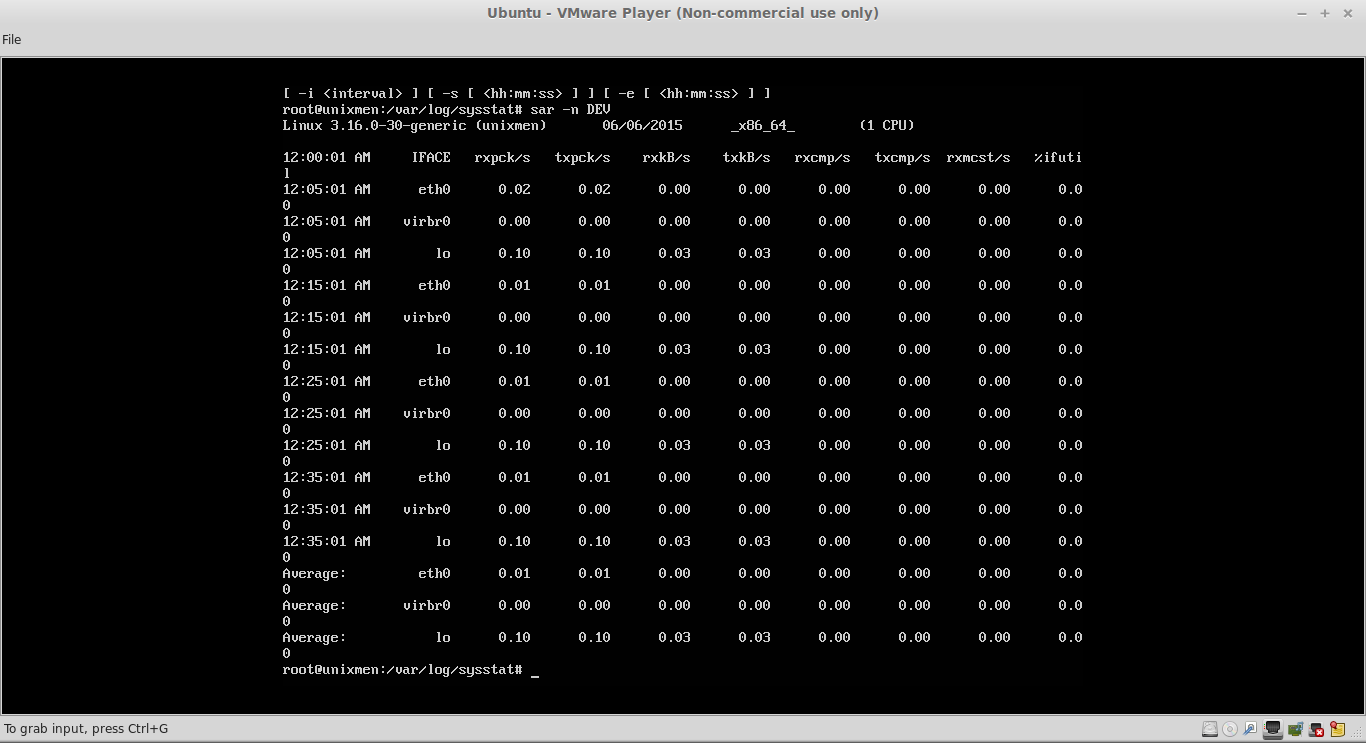
‘-n’ DEV option will display current network status
sar -n DEV
Hope these tools will be useful for you.
Have fun!!


