
Introduction
Nagios is the leader and industry standard in enterprise-class monitoring solutions. Nagios provides two monitoirng tools Nagios Core and Nagios XI.
Nagios Core is a free and open source tool that allows you to monitor your entire IT infrastructure to ensure hosts, services and applications are functioning properly.
Nagios XI is based on Nagios Core and is the commercial solution of Nagios. Nagios XI provides organizations with many benefits:
- Comprehensive IT Infrastructure Monitoring
- Advanced Graphs & Visualizations
- Advanced Infrastructure Management Capabilities
- Monitoring Wizard
- Easily and Advanced User Management
For more informations, you can visit the website of Nagios, and check our article in this link .
Purpose and Target Audience
This artilce is intended for use by Nagios Administrators who wish to monitor Linux servers with Nagios XI using the linux NRPE agent. The linux NRPE agent must be installed on the target linux machine and configured before Nagios XI can monitor system metrics, services, processes, or performance data on the target machine.
If you still didn’t install Nagios-Xi , check this article to see how to do that.
In this article we will show you how to install and configure NRPE AGENT in the remote server and how to add the host to Nagios Xi.
Installing and Configuring NRPE On The Remote
Linux Machine
Download the Linux NRPE agent to the /tmp directory on the Linux server you wish to monitor.
cd /tmp
For RHEL/CentOS 5+, Fedora 14+, SLES 11+, OpenSUSE 11+, Ubuntu 12+, and Debian 6+:
wget http://assets.nagios.com/downloads/nagiosxi/agents/linux-nrpe-agent.tar.gz
For RHEL 4 & CentOS 4 (el4):
wget http://assets.nagios.com/downloads/nagiosxi/agents/linux-nrpe-agent-el4.tar.gz
Unpack the installation archive you just downloaded:
tar xzf linux-nrpe-agent.tar.gz
Enter the newly created agent sub-directory:
cd linux-nrpe-agent
You need to run the wrapper script as root (if using Ubuntu you’ll need to either run sudo -i to run as root):
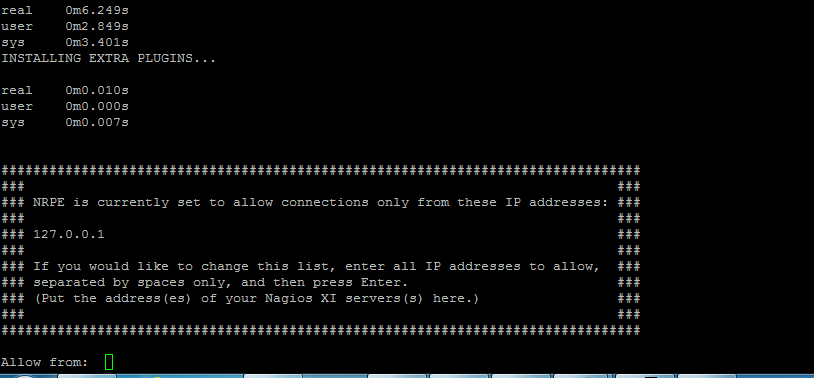
sudo ./fullinstall
The script will stop to prompt you once, to ask for the IP address(es) for your monitoring server(s). You will need to type the ip address, of your Nagios Xi server and then press enter. This will allow connections from your monitoring server to the agent process.
Configuring Nagios Xi to Monitor the Linux Host
You have now successfully installed and configured the monitoring agent and required plugins on the Linux server. In order to monitor the server using Nagios XI, you will need to run the Linux Server configuration wizard in the Nagios XI web interface.
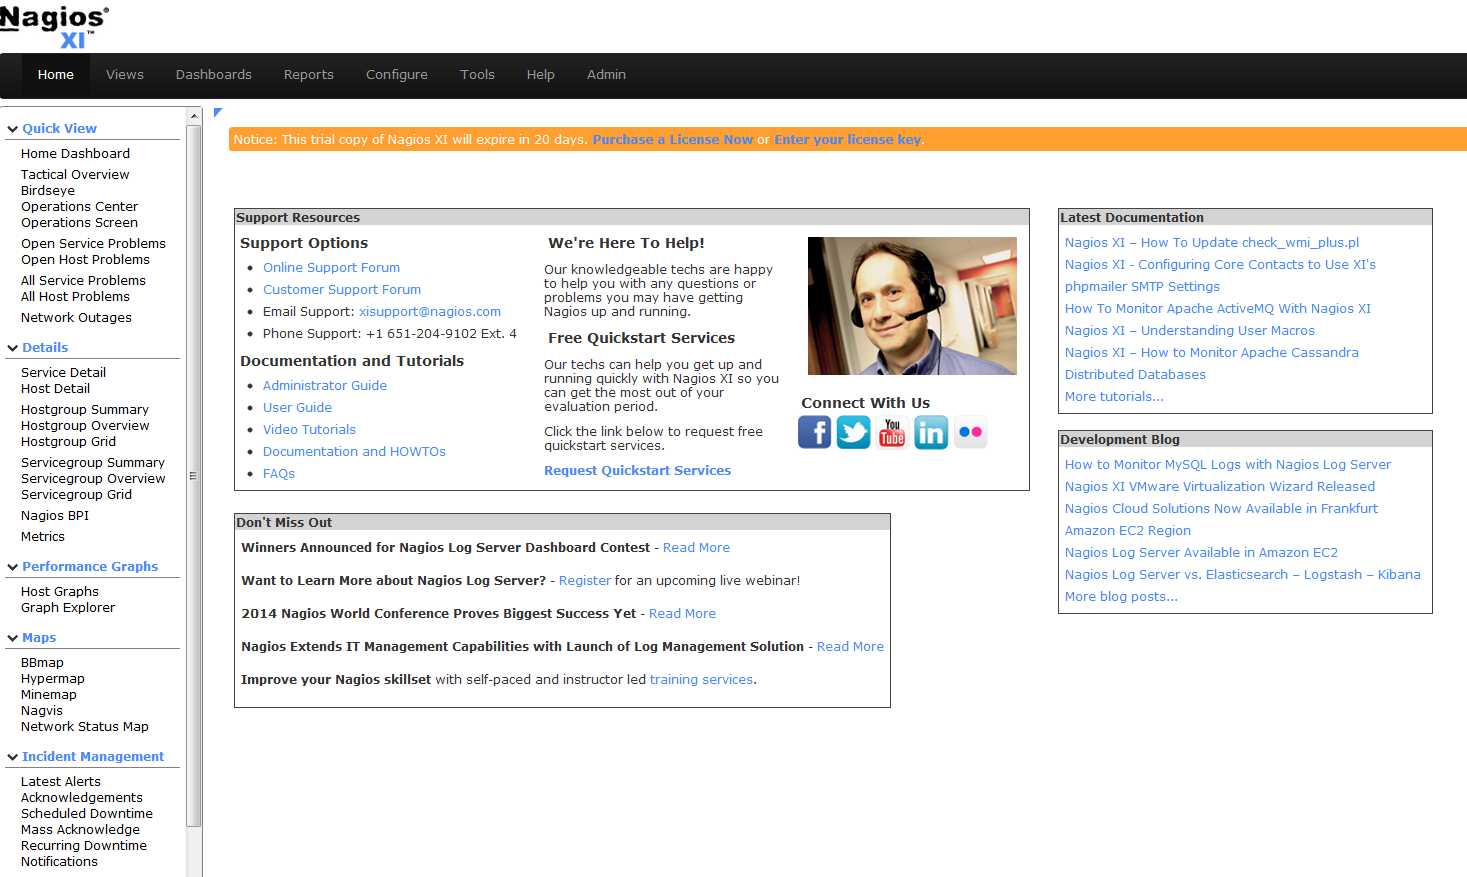
Log into the web interface via : http://[SERVER_IP]/ and enter your login information. You will see this page after the login.
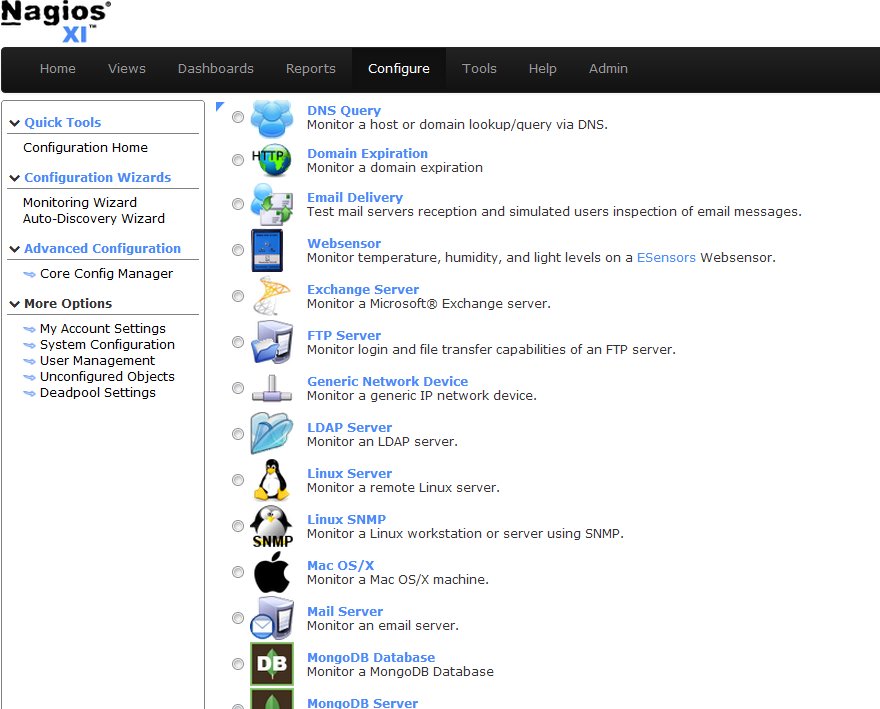
Choose Configure to start the host configuration.
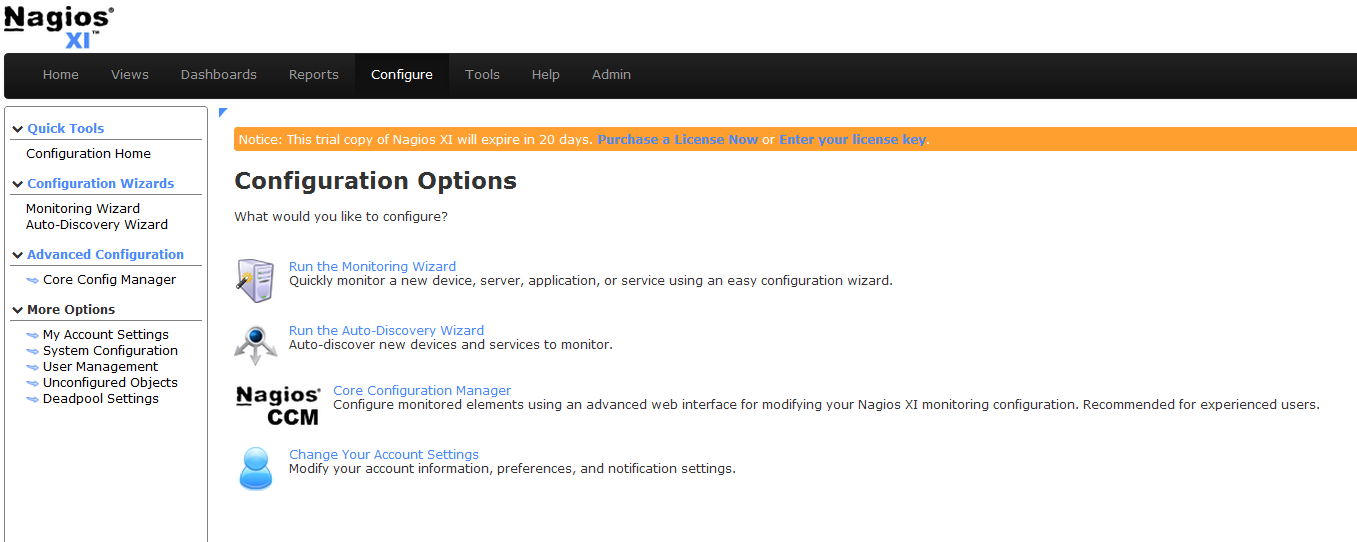
Go Under Run the Monitoring Wizard
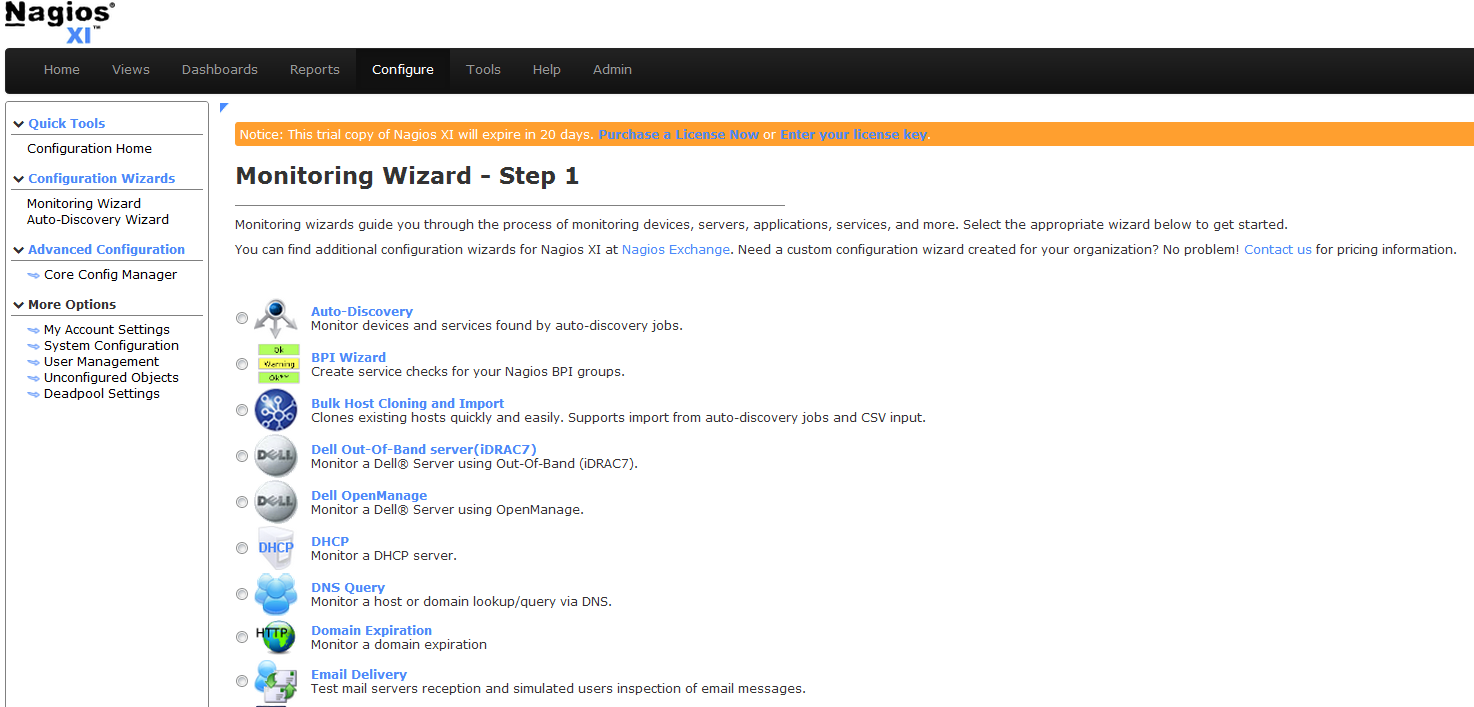
You need to choose Linux Server wizard to monitor your host.
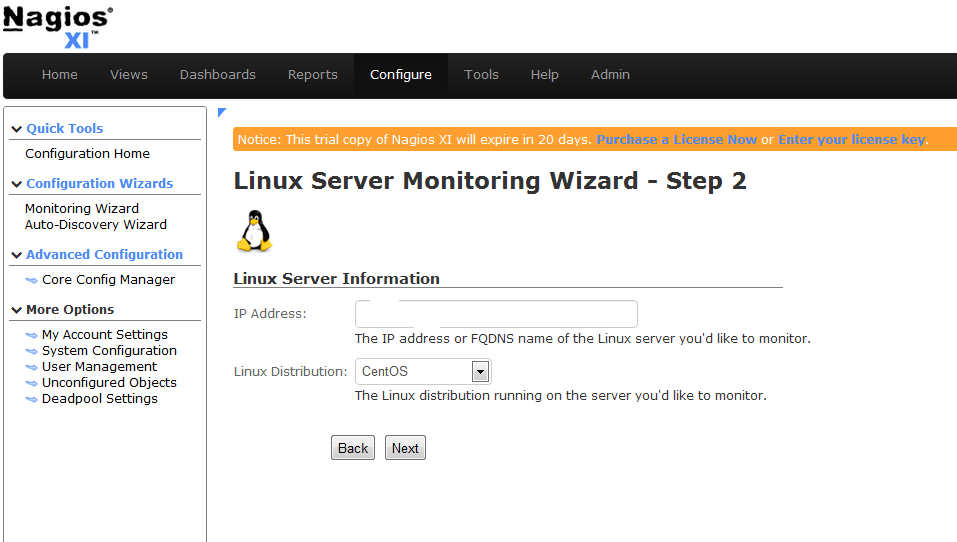
Next, we set the device parameters.
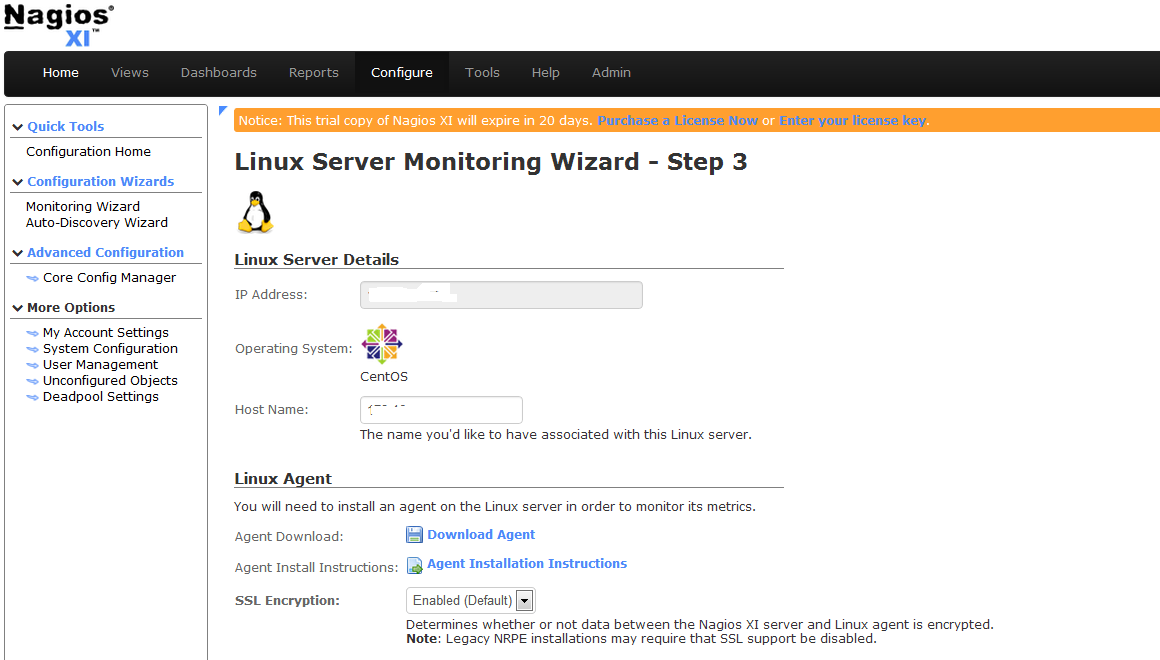
Now that the device has been added.
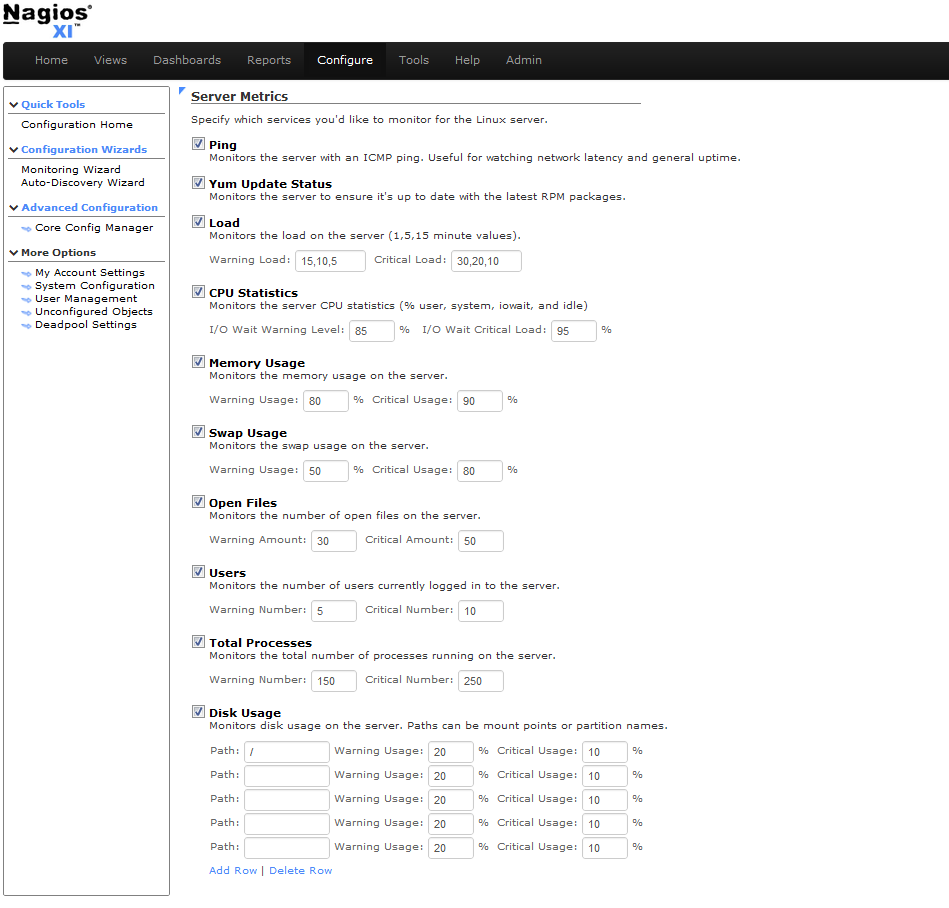
We specify the services that we want to create. This section can be found in the bottom section of the page.
Enter the information regarding the polling strategy:
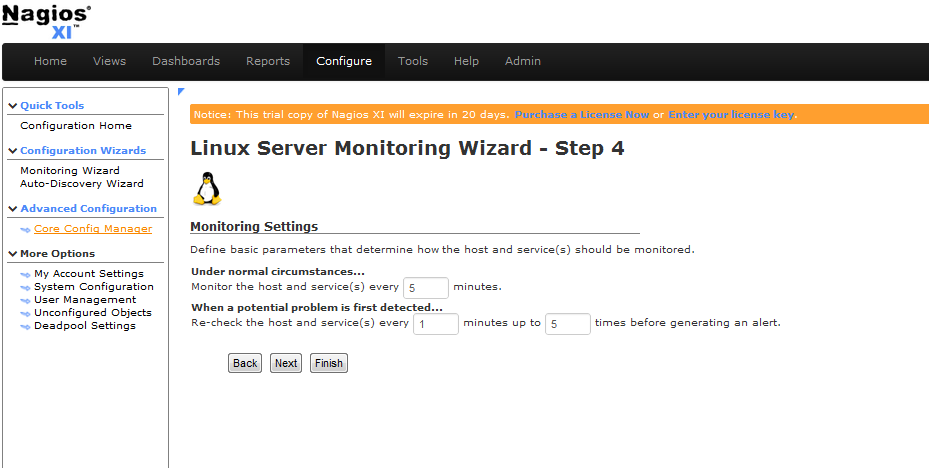
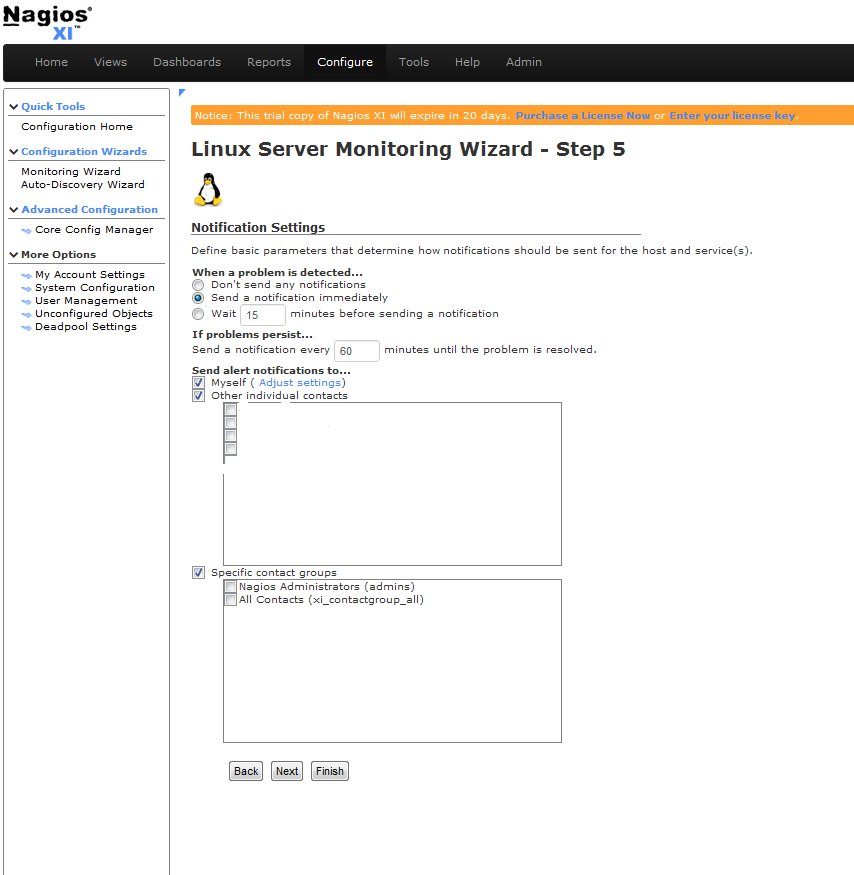
Our host and services will then be checked every 5 minutes and an alert will be sent out 5 minutes after our host goes « DOWN » (5 check attempts with 1 check every 1 minutes will confirm its « HARD » state). Next you need the configure the notification settings.
The notification will be send immediately in case of alert and every 60 minutes until the problem is resolved.
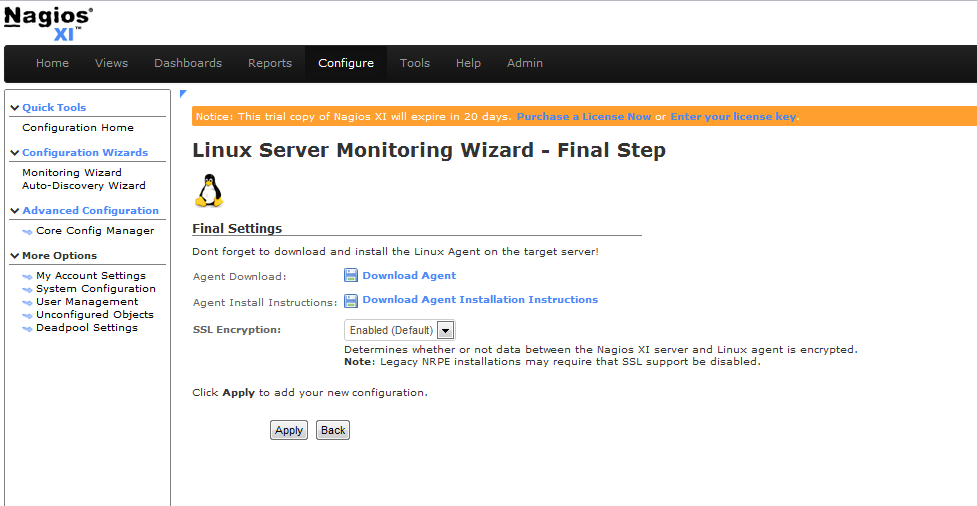
At last, the notification parameters are as follows:
After you should click Apply to add the host and finish the new configuration.
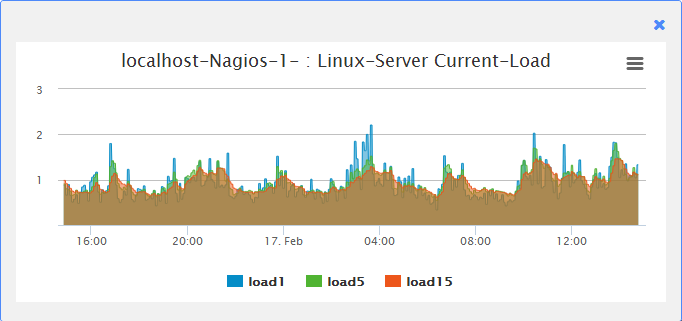
The results of the polling are visible in the Home => Host Details.
After period of time you can need to see a graphs like this which is the Current-Load.
That’s all.
Congratulations! Enjoy your new Monitoring platform Nagios Xi.


