Introduction
Monitorix is a free, Open Source monitoring tool that can be used to monitor as many services and system resources as possible. Unlike other monitoring tools, it is very simple to install, configure and monitor the systems. Initially, it was developed to support only the RPM based systems such as Red Hat, CentOS etc., but, later it is expanded it’s support to other distributions like Debian/Ubuntu, and BSD systems such as FreeBSD, NetBSD, and OpenBSD.
Since version 3.0, it comes with a built-in web server, so there is no need of any external webserver. It regularly collects the system and network resources of a Linux system, and displays the results as Graphs using RRDTool. It consists mainly of two programs called monitorix and monitorix.cgi. monitorix is a perl daemon which is started automatically just like as any system service, and monitorix.cgi is a CGI script. Monitorix is licensed under GNU GPLv2, so it is absolutely free to use, and distribute.
Features
Yet Monitorix is lightweight and simple, it has a comprehensive list of features like a enterprise network monitoring tools such as nagios or Zabbix.
Here is the list of features included in Monitorix.
- System load average and usage;
- Global kernel usage, Per-processor kernel usage;
- HP ProLiant System Health;
- LM-Sensors and GPU temperatures;
- NVIDIA temperatures and usage;
- Disk drive temperatures and health;
- Filesystem usage and I/O activity;
- Network traffic and usage;
- Display statistics of almost all services such as; Netstat, Process, mail, ftp, Apache, nginx, lighttpd, MySQL, Squid proxy web cache, NFS server/client, Bind, NTP, Fail2ban, Icecast streaming, Raspberry pi sensor, Alternative PHP Cache, Memcached, APC UPS, Wowza Media Server & Libvert etc.
- System services demand;
- Network port traffic;
- Users using the system;
- Support for monitoring remote servers;
- Alert capabilities supported;
- Ability to include additional configuration file(s);
- Ability to view statistics per day, week, month or year;
- Ability to view statistics in graphs or in plain text tables;
- Ability to zoom in any graph to see it in more detail;
- Ability to show network metrics in MBytes/sec or Mbits/sec;
- Ability to show temperatures in Celsius or in Fahrenheit;
- Ability to configure the number of years of historical data (up to 5 years);
- Web interface offers minimal learning, ubiquitous access;
- Configuration with only one text-plain file;
- Silent mode to be able to retrieve the graphs from scripts;
- And many more.
Installation
Install Monitorix in RPM based systems:
First of all, add EPEL repository in your server. In our case, I tested this how-to on CentOS 7 64bit.
If you use CentOS 6.x like systems, use the following link to install EPEL Repository.
Now, install the following prerequisites.
yum install rrdtool rrdtool-perl perl-libwww-perl perl-MailTools perl-MIME-Lite perl-CGI perl-DBI perl-XML-Simple perl-Config-General perl-HTTP-Server-Simple
Then, go to Monitorix download page, and get the the latest version. As of writing this, the most recent version was 3.6.0.
wget http://www.monitorix.org/monitorix-3.6.0-1.noarch.rpm
Now, install the downloaded Monitorix RPM file using the following command:
rpm -ivh monitorix-3.6.0-1.noarch.rpm
Once succesfully installed, please take a look into the configuration file /etc/monitorix.conf to set the options according your system and enable or disable graphs.
Finally start Monitorix service using command:
On CentOS 7:
systemctl start monitorix
On CentOS 6.x:
service monitorix start
chkconfig monitorix on
Be mindful that, some graphs might not be visible due to SELInux. So, disable it to view all graphs.
vi /etc/sysconfig/selinux
Change SELINUX=enforcing to SELINUX=disabled.
[...]
SELINUX=disabled
[...]
Reboot your system.
That’s it. Monitorix has been successfully installed on your system.
Install Monitorix in DEB based systems:
First, update your system:
sudo apt-get update
Install the following prerequisites:
sudo apt-get install rrdtool perl libwww-perl libmailtools-perl libmime-lite-perl librrds-perl
libdbi-perl libxml-simple-perl libhttp-server-simple-perl libconfig-general-perl
libio-socket-ssl-perl wget
Then, got to Monitorix download page, and get the latest version.
wget http://www.monitorix.org/monitorix_3.6.0-izzy1_all.deb
Finally, Install monitorix using commands:
sudo dpkg -i monitorix_3.6.0-izzy1_all.deb
sudo apt-get install -f
Alternatively, you can easily install monitorix using IzzySoft repository.
Edit file /etc/apt/sources.list,
sudo nano /etc/apt/sources.list
Add the IzzySoft repository location at the end:
[...]
deb http://apt.izzysoft.de/ubuntu generic universe
Save and exit the file. Then, download and add the GPG key.
wget http://apt.izzysoft.de/izzysoft.asc
sudo apt-key add izzysoft.asc
Now, update the repositories, and install monitorix using the following commands:
sudo apt-get update && sudo apt-get install monitorix
Finally, start monitorix service to start monitoring your Linux host.
sudo service monitorix start
Monitorix ships with a default configuration file which works out-of-the-box. Moreover, the service is automatically started on package installation.
To fine-tune your installation, take a look at the /etc/monitorix/monitorix.conf file to adjust some things (like network interfaces, filesystems, disks, etc.).
Note: The Debian package also comes with an extra configuration file in /etc/monitorix/conf.d/00-debian.conf that includes some options specially adapted for Debian systems. This file will be loaded right after the main configuration file, hence some options in the main configuration will be overwritten by this extra file.
That’s it. Monitorix has been installed on your deb based system.
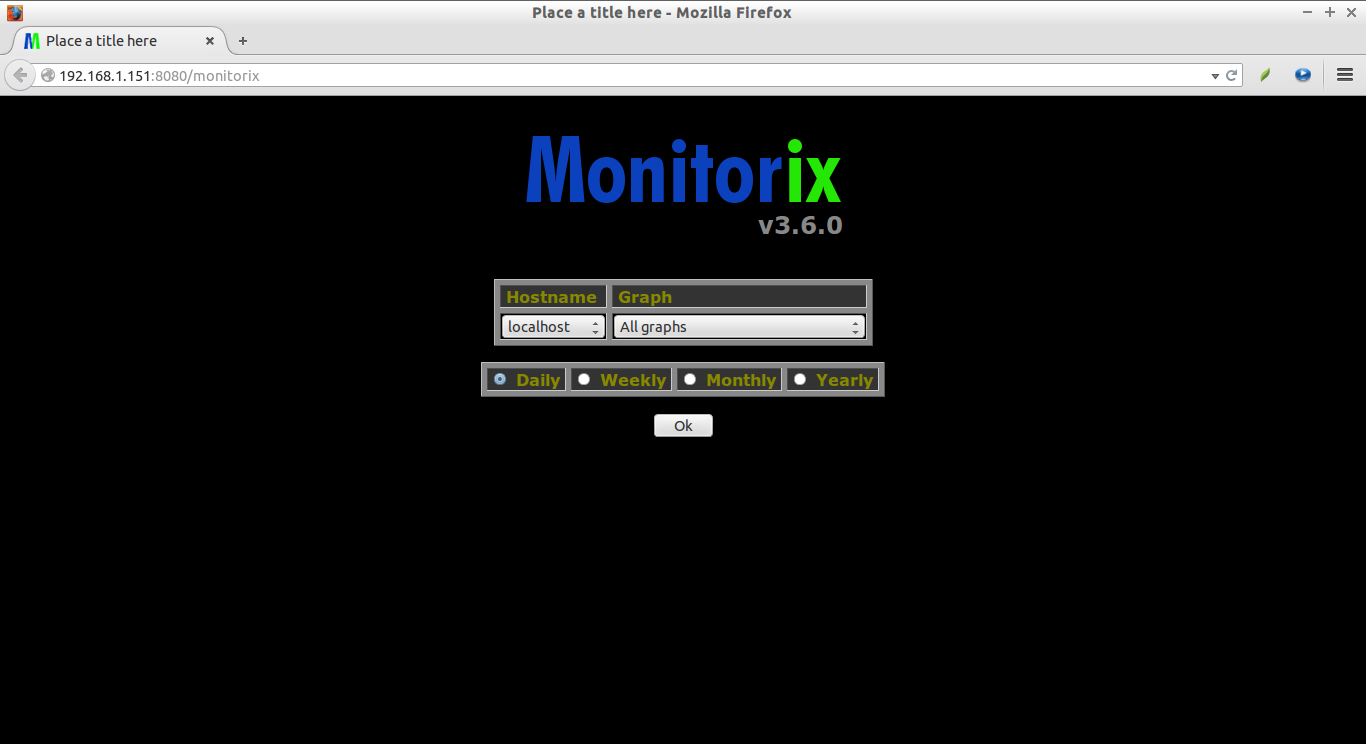
Access Monitorix Web console
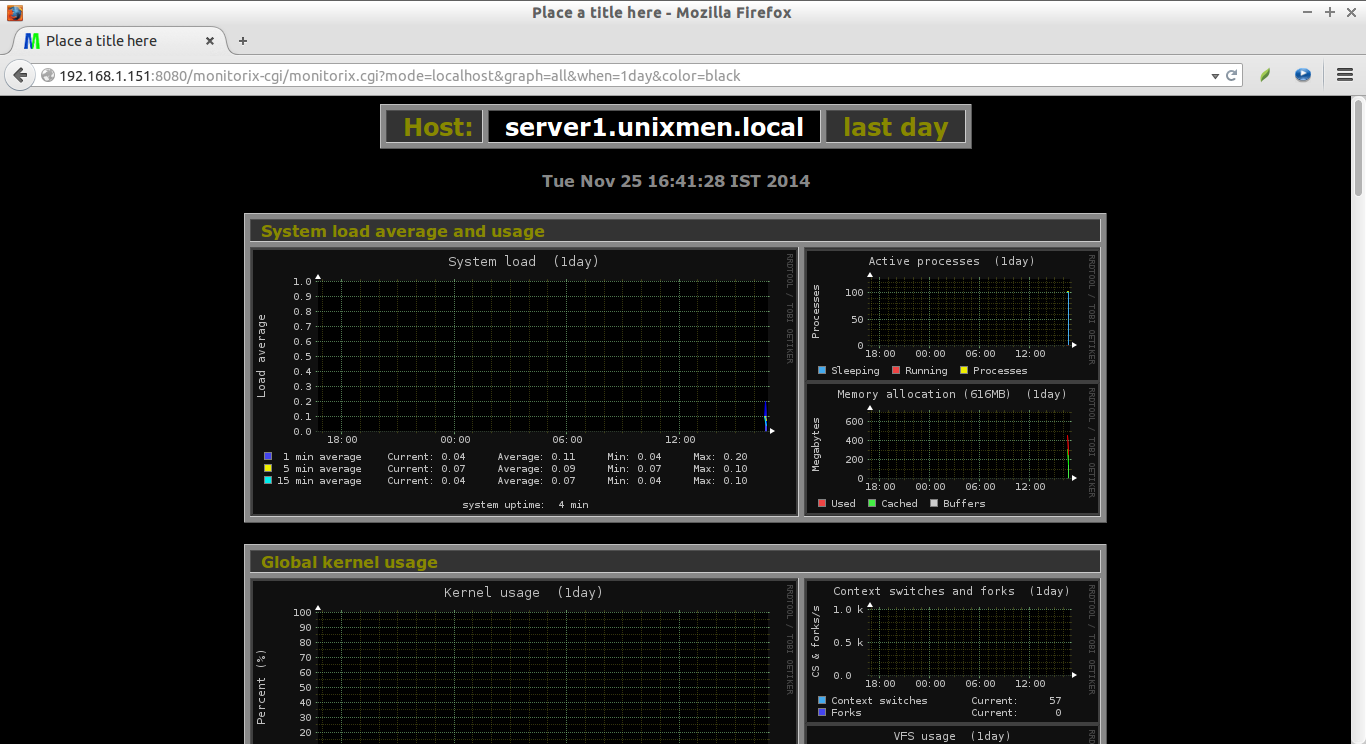
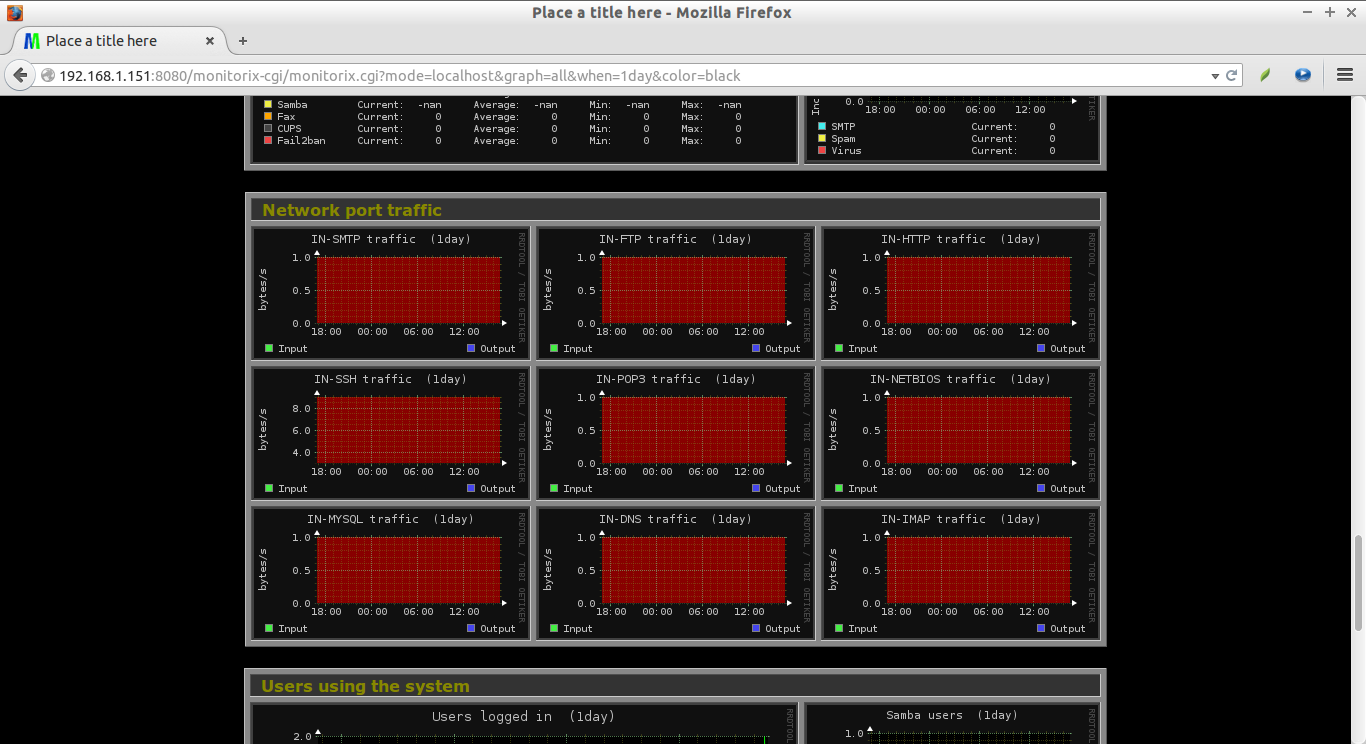
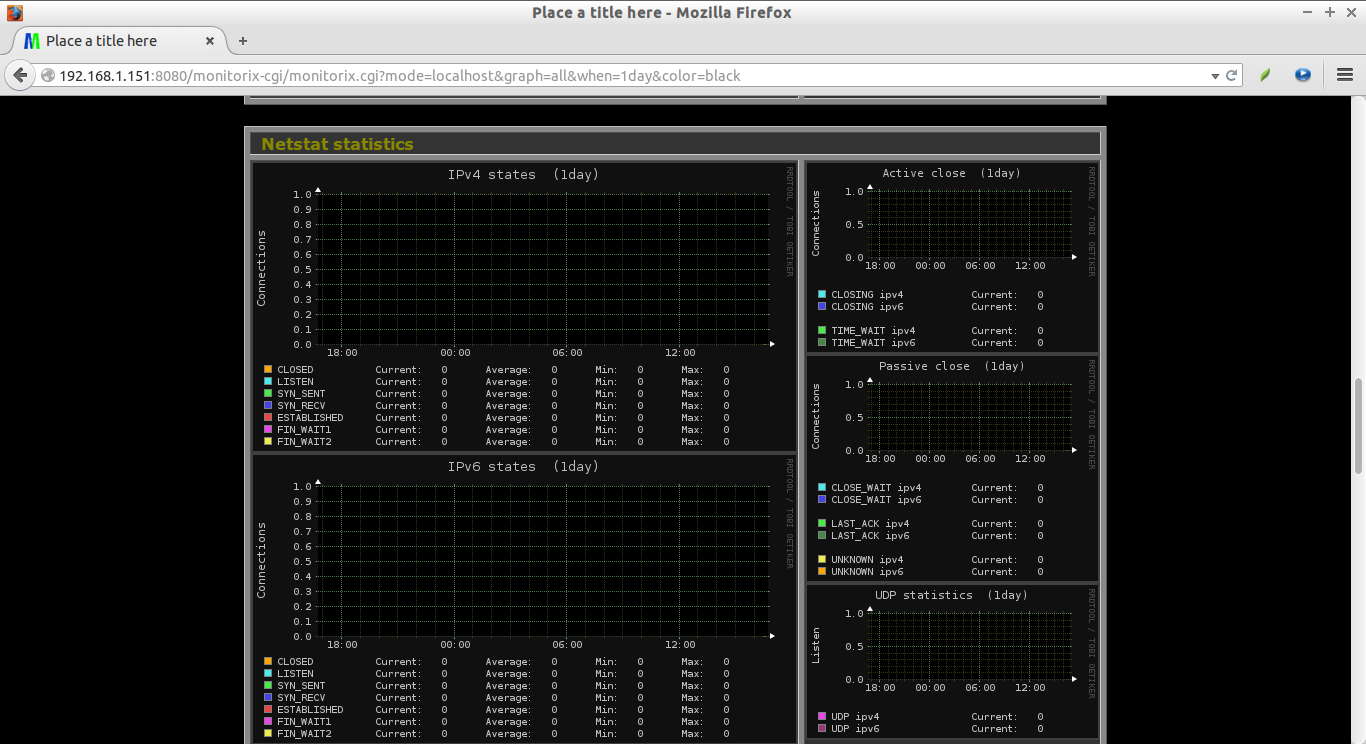
After installing monitorix, navigate to http://ip-address:8080/monitorix from your web browser. You’ll see the results in graphs as shown in the below screenshots.
Sample Screenshots:
Happy monitoring!
Cheers!


