
Introduction
Centreon is an Open Source software package that lets you supervise all the infrastructure and applications comprising your information system.
CES Standard is the Open and free version of the product. Centreon Enterprise Server (CES) includes all Centreon functions in a unique product.
For more information, you can visit the website of Centreon, and check our article in this link .
Purpose and Target Audience
This article describes how to monitor your drupal website with Centreon using Nagios Monitoring Module. The Nagios monitoring
Module can be obtained from direct download from the Drupal Module downloads page at https://www.drupal.org/project/nagios.
The Nagios Monitoring Module must be installed on the website server and configured before Centreon can monitor the drupal website.
This article is intended for use by Centreon Administrators who want to monitor drupal website with Centreon.
If you still didn’t install Centreon, check this article to see how to do that.
Pre-requisites
To be able to make the configurations in this article you’ll need admin access on both the Drupal server and on the Centreon system. You will need to install a Drupal module and then install a Nagios plugin.
About Nagios Monitoring Module
In this article, you be able to use the nagios monitoring module to monitor your Drupal CMS installation. With this module you’ll be able use Centreon to tell you if your Drupal website is running as expected, including:
- PHP is parsing scripts and modules correctly (in case PHP gets disabled for some reason)
- The database is accessible from Drupal
- Whether there are configuration issues with the site, such as:
- Pending Drupal version or module updates
- Unwritable ‘files’ directory
- Pending updates to the database schema
- Cron not running for a specified period
- Anything else reported in the Administer -> Reports -> Status report (requirements)
Configure Nagios Monitoring Module On the Drupal Website
Firstly you will need to go to drupal.org and download the Nagios monitoring module.
Add the module to your Drupal server by either copying the file to your server and moving it to the “../modules/” folder, then extracting (tar –zxvf nagios-7.x-1.2.tar.gz) or navigate to your Drupal GUI and via the “Modules” page, click “Install new module” and paste the hyperlink above.
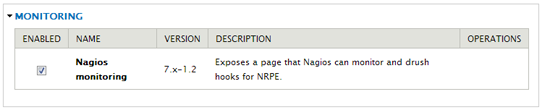
Once the module is installed you will need to activate it and then configure it.Firstly navigate to the modules page and find the “Nagios monitoring” module in the “Monitoring section”, then enable it.
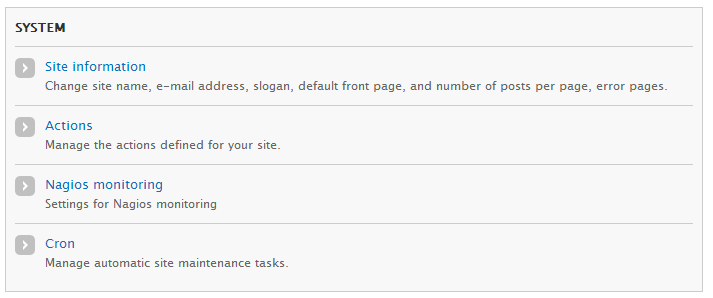
Next, after enabling the module, you must configure it. On Drupal Version 7, navigate to “Configuration > System > Nagios Monitoring”.
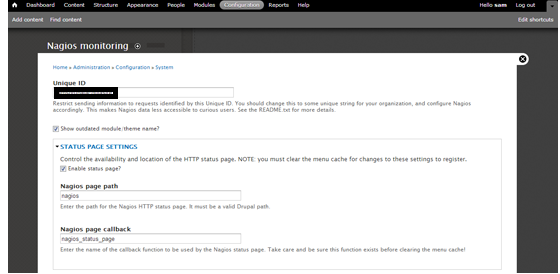
On this page, you need to set the “Unique ID” for the Drupal site, as this example :
Drupal website is now configured and ready for monitoring with Centreon.
Configure Centreon with command Line
First step to do is to download the “check_drupal” plugin from the Nagios Exchange and copy it to your Centreon system. It’s useful to be familiar with running your plugin from the command line, for both informational and debugging purposes.
On the Centreon server, move the plugin to “/usr/local/nagios/libexec” and ensure the permissions are correctly set
chown nagios:nagios /usr/local/nagios/libexec/check_drupal
chmod +x /usr/local/nagios/libexec/check_drupal
The next step is to run a test command using the unique ID you set above.
$ ./check_drupal -U drupalunixmen -H 172.16.0.15/unixmen
DRUPAL CRITICAL, ADMIN:CRITICAL=Configuration file, Drupal core update status, CRON:OK | SAN=0;SAU=1;NOD=1;USR=1;MOD=34;THM=4
As above, you can now see that the plugin is talking to the Drupal module correctly.
If you see an error such as:
$ ./check_drupal -H 192.168.0.16/unixmen
wget error: 8: when accessing 192.168.0.16/unixmen/nagios. HTTP:   HTTP/1.0 404 Not Found
Then the “-U uniqueid” is not specified in the command, or set via the Drupal module.
As the test is successful you can now proceed to building service checks to monitor your Drupal site with the Centreon Gui.
Configuring Centreon to Monitor the Drupal Website
Once the installation of Drupal Monitoring Module is done, it’s about time we start with the configuration of our objects.
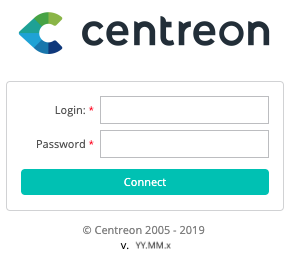
Log into the web interface via : http://[SERVER_IP]/centreon and enter your login information.
Host configuration
First step to do is to add the Website host.
Go under « Configuration → Hosts → Add »:

In the general information, fill out the fields: :
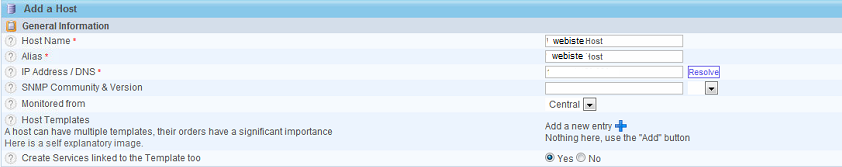
Enter the information regarding the polling strategy:

Our host will then be checked every 5 minutes and an alert will be sent out 4 minutes after our host goes « DOWN » (2 check attempts with 1 check every 2 minutes will confirm its « HARD » state). The notification will be effective during the time period of 24 hours a day, 7 days a week.
At last, the notification parameters are as follows:

Then, click on « Save ».
Services configuration
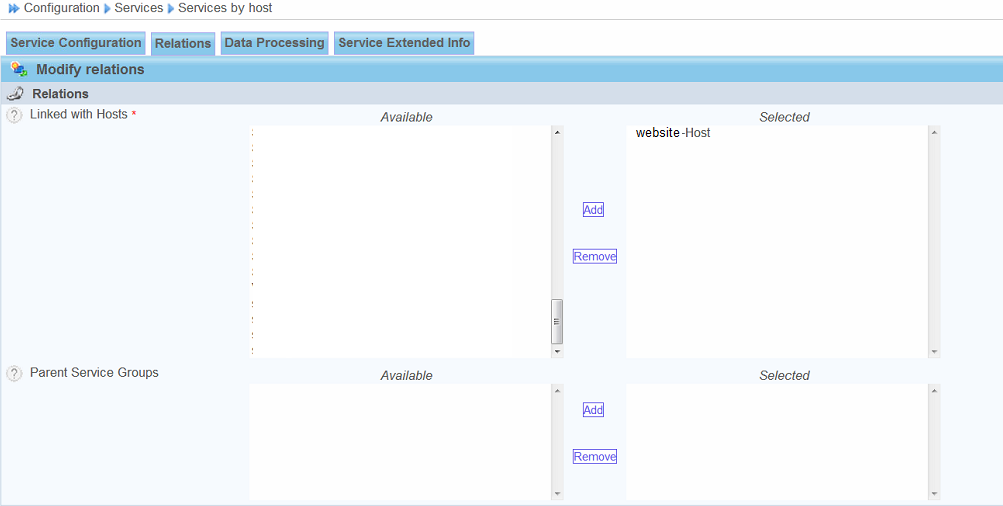
The configuration of our host is now done; all we have left to do is add the definitions of our services. In order to do so,
Go to « Configuration → Services → Services by hosts → Add »:

In the « Relations » tab, select the host that was previously created, then click on « Save »:
Generation of configuration files
Once the hosts and services are created and properly configured, it is required to generate the configuration files through two steps:
• configuration testing;
• configuration export.
Go to the « Configuration → Monitoring Engines → Generate » menu:

First, select the monitoring poller from the dropdown menu, check the first two check-boxes, and then click on the « Export » button:

If the output is the test is « Generating files… OK », then you can go to step #2. Otherwise, it is required to fix the problems which should be displayed in the console.
Now, check the two other check-boxes and click on the « Export » button again:

If the export process is successful, you should see the following displayed: “Restarting engine… OK”
That’s all. We hope that this article help you to monitor your drupal website.


