
What is htop ? htop is a Linux tool divided into three section ( CPU and Memory usage information, Load Average Uptime and View of Processes) which allows real time monitoring of the processes. It was created to replace the ‘top’ command line unix utility and it is much easier to use for simple and normal tasks. Figure 1 shows htop running on my ubuntu machine.
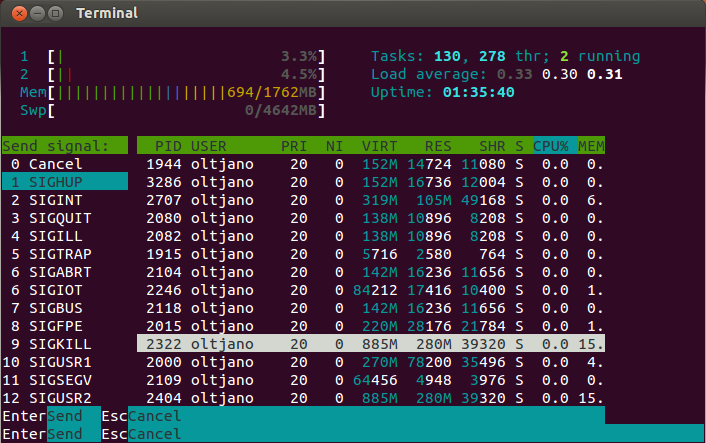 Figure 1
It is a cross-platform process viewer that users can easily interact with. It requires ncurses to run and works in text mode for easy use with consoles and X terminals. The latest version of htop works on Solaris, Linux, DragonFly BSD, FreeBSD, OpenBSD, and MacOSX.
Unlike the top tool, htop allows its users to scroll vertically and horizontally. Further, users can interact with the tool using their mouse. The tool will show you all of the processes running on the machine and their respective command-line arguments.
Viewing the tasks in the tree format is easy, and users can also select multiple processes in one go and act on them all at once. One of the biggest advantages of using htop is that performing actions such as killing tasks does not require entering the process’s PID.
Identifying which process is slowing down your computer is an easy task in htop. It shows your usage per cpu and very detailed information about each process. The htop does not come installed by default in Linux distributions but installation is as simple as apt-get command. Run ‘sudo apt-get install htop’ command in your terminal like shown in Figure2.
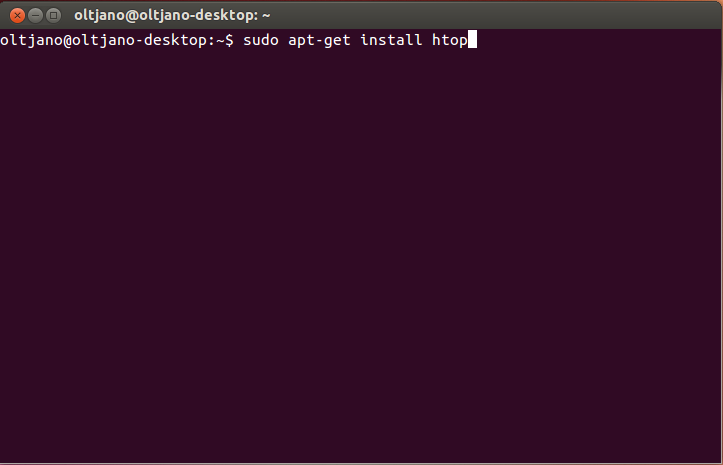 Figure 2
After the installation is finished to run htop type ‘htop’ command in a terminal windows and press enter.
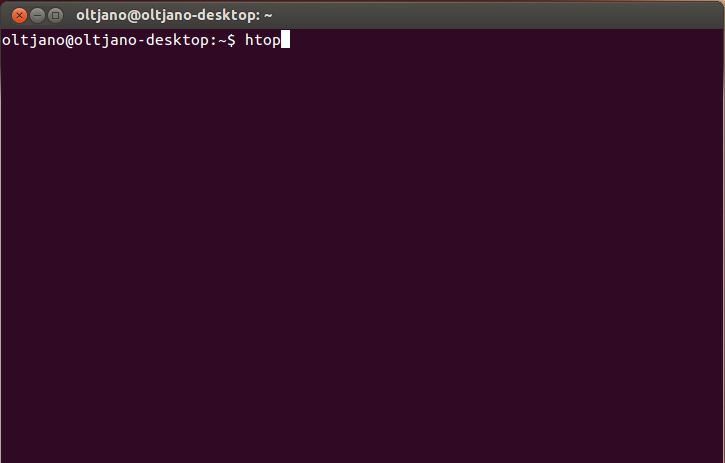
Figure 3 – Running htop
Available Command-Line Options for htop
It’s important for you to note that the mandatory arguments to long options are also mandatory for the short options. You can use the following options with htop:
- -d: It will give a tenth-of-a-second delay between updates. If the delay is less than 1, the option will increase it to 1. However, if the delay is greater than 100, the option will decrease it to 100 and make it 10 seconds.
- -c: It starts htop in monochrome mode
- -F: It will filter the processes by command
- -h: Using this option will make the help message appear and exit htop
- -p: Using this option displays only the PIDs that you supply
- -s: It will sort the list by column. Bear in mind that using this option will force a list view unless the -t option is used in conjunction.
- -u: It shows the processes that the supplied user is running
- -U: It uses ASCII characters in the graph meters
- -M: It disables the ability to use the mouse with htop
- –readonly: It disables all the system and process altering features
- -V: Returns the version of htop and exits
- -t: Use this option to view the processes in a tree view. Using this in conjunction with -s will force a tree view
- -H: It highlights both new and old processes
- –drop-capabilities: It only works on Linux systems and drops the unneeded Linux capabilities
Useful Interactive Commands of htop
- Space: Tags or untags a process
- c: Tags the current process and its child processes
- U: Untags all processes
- L: Displays the open files for a process. Pressing the L key will make the list of file descriptors appear if lsof(1) is installed on the machine.
- F2: Displays the setup screen
- F3: Pressing this key will incrementally search the command lines of the machine’s processes. You can press Shift+F3 if you want to cycle searching the command lines backward.
- F5: Organizes the processes by parenthood, and the relations between them appear in the tree format.
- F6: Pressing this key will select a field for sorting
- F7: It increases the priority of the selected process
- F8: It decreases the priority of the selected process
- F9: Kills a process or all the tagged processes
- F10: Quits htop
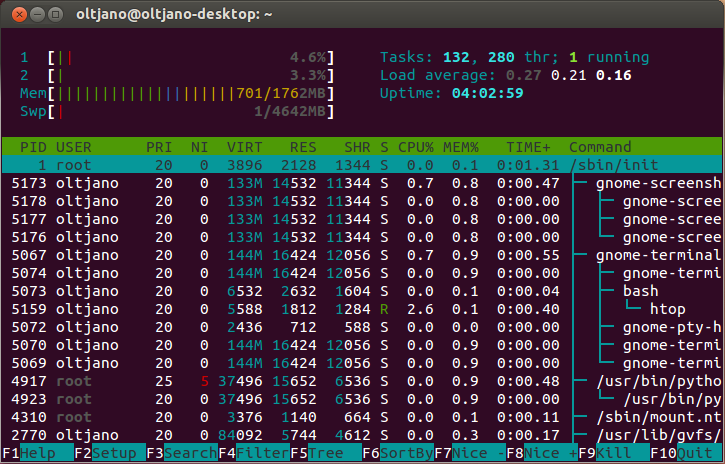 Figure 4
The CPU and Memory section located on the top left gives information about the number of cpu cores with a progress bar in different colors. This progress bar represents the load of cpu cores. Different colors stand for different things , for example the green color of progress bars in Figure means normal processes. Up and down arrow keys help you to select a process while left and right allow you to scroll horizontaly. How do you kill a process ? Ti kill a process with htop you don’t need the pid, just use the up/down arrow keys to select the process you want to kills and press F9 like shown in Figure 5.
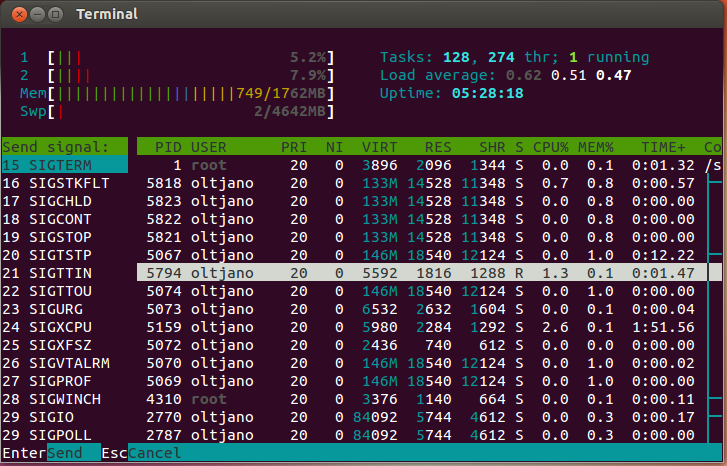
Figure 5
Press Enter to send the ‘killing signal’ or Esc to Cancel. To change the display color press F2 to enter setup and go to colors using arrow keys or mouse.
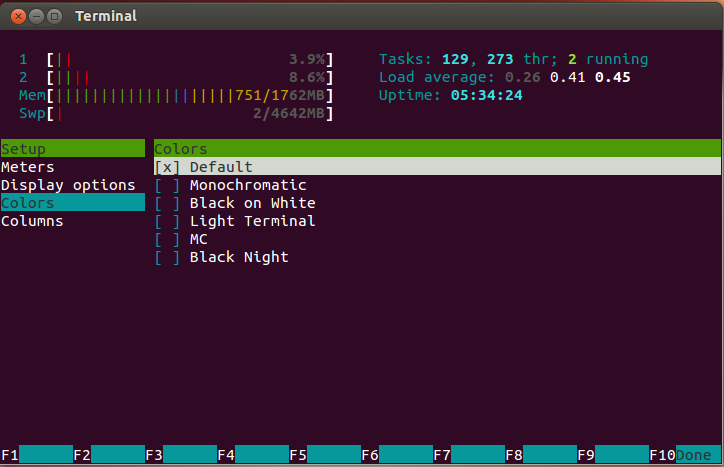 Figure 6
I will choose Light Terminal and press F10 to save it.


