
It is very important to keep an eye on your system temperature. Because overheating may cause unexpected hardware failures. This brief tutorial describes how to monitor your CPU and other system hardware temperatures, fan speeds, and voltages using a command line utility called lm-sensors.
Installation
Lm-sensors will be available in the default repositories of most modern Linux operating systems.
On DEB based systems:
sudo apt-get install lm-sensors
On RPM based systems:
sudo yum install lm-sensors
Usage
After installing lm-sensors on your system, run the following command to determine which kernel modules you need to load to use lm_sensors most effectively. It is generally safe and recommended to accept the default answers to all questions, unless you know what you’re doing.
sudo sensors-detect
Sample output:
I go with default answers. Simply press Enter key to accept the default answers.
# sensors-detect revision 6170 (2013-05-20 21:25:22 +0200)
# System: Dell Inc. Inspiron N5050 [Not Specified] (laptop)
# Board: Dell Inc. 01HXXJ

This program will help you determine which kernel modules you need
to load to use lm_sensors most effectively. It is generally safe
and recommended to accept the default answers to all questions,
unless you know what you're doing.

Some south bridges, CPUs or memory controllers contain embedded sensors.
Do you want to scan for them? This is totally safe. (YES/no):
Module cpuid loaded successfully.
Silicon Integrated Systems SIS5595...                       No
VIA VT82C686 Integrated Sensors...                          No
VIA VT8231 Integrated Sensors...                            No
AMD K8 thermal sensors...                                   No
AMD Family 10h thermal sensors...                           No
AMD Family 11h thermal sensors...                           No
AMD Family 12h and 14h thermal sensors...                   No
AMD Family 15h thermal sensors...                           No
AMD Family 15h power sensors...                             No
AMD Family 16h power sensors...                             No
Intel digital thermal sensor...                             Success!
    (driver `coretemp')
Intel AMB FB-DIMM thermal sensor...                         No
VIA C7 thermal sensor...                                    No
VIA Nano thermal sensor...                                  No

Some Super I/O chips contain embedded sensors. We have to write to
standard I/O ports to probe them. This is usually safe.
Do you want to scan for Super I/O sensors? (YES/no):
Probing for Super-I/O at 0x2e/0x2f
Trying family `National Semiconductor/ITE'...               No
Trying family `SMSC'...                                     No
Trying family `VIA/Winbond/Nuvoton/Fintek'...               No
Trying family `ITE'...                                      No
Probing for Super-I/O at 0x4e/0x4f
Trying family `National Semiconductor/ITE'...               Yes
Found unknown chip with ID 0xfc11

Some hardware monitoring chips are accessible through the ISA I/O ports.
We have to write to arbitrary I/O ports to probe them. This is usually
safe though. Yes, you do have ISA I/O ports even if you do not have any
ISA slots! Do you want to scan the ISA I/O ports? (YES/no):
Probing for `National Semiconductor LM78' at 0x290...       No
Probing for `National Semiconductor LM79' at 0x290...       No
Probing for `Winbond W83781D' at 0x290...                   No
Probing for `Winbond W83782D' at 0x290...                   No

Lastly, we can probe the I2C/SMBus adapters for connected hardware
monitoring devices. This is the most risky part, and while it works
reasonably well on most systems, it has been reported to cause trouble
on some systems.
Do you want to probe the I2C/SMBus adapters now? (YES/no):
Using driver `i2c-i801' for device 0000:00:1f.3: Intel Cougar Point (PCH)
Module i2c-i801 loaded successfully.
Module i2c-dev loaded successfully.

Next adapter: i915 gmbus ssc (i2c-0)
Do you want to scan it? (yes/NO/selectively):

Next adapter: i915 gmbus vga (i2c-1)
Do you want to scan it? (yes/NO/selectively):

Next adapter: i915 gmbus panel (i2c-2)
Do you want to scan it? (yes/NO/selectively):

Next adapter: i915 gmbus dpc (i2c-3)
Do you want to scan it? (yes/NO/selectively):

Next adapter: i915 gmbus dpb (i2c-4)
Do you want to scan it? (yes/NO/selectively):

Next adapter: i915 gmbus dpd (i2c-5)
Do you want to scan it? (yes/NO/selectively):

Next adapter: DPDDC-B (i2c-6)
Do you want to scan it? (yes/NO/selectively):

Now follows a summary of the probes I have just done.
Just press ENTER to continue:

Driver `coretemp':
  * Chip `Intel digital thermal sensor' (confidence: 9)

To load everything that is needed, add this to /etc/modules:
#----cut here----
# Chip drivers
coretemp
#----cut here----
If you have some drivers built into your kernel, the list above will
contain too many modules. Skip the appropriate ones!

Do you want to add these lines automatically to /etc/modules? (yes/NO)

Unloading i2c-dev... OK
Unloading i2c-i801... OK
Unloading cpuid... OK
Next, run the following command to find the temperature.
sudo sensors
Sample output:
acpitz-virtual-0
Adapter: Virtual device
temp1:        +55.5°C  (crit = +84.0°C)

coretemp-isa-0000
Adapter: ISA adapter
Physical id 0:  +59.0°C  (high = +80.0°C, crit = +85.0°C)
Core 0:         +59.0°C  (high = +80.0°C, crit = +85.0°C)
Core 1:         +59.0°C  (high = +80.0°C, crit = +85.0°C)
As you in the above output, our system temperature is normal. Also, the output what is the higher and critical temperature. If you reached that critical level, It is recommended to take steps to reduce the temperature. Whether we shall power off the system or close/stop some running unwanted programs/processes if any.
If you’re using Laptop and having overheating issues, you might want to check the following article.
Displaying Temperature results in Fahrenheit
If you want to get the output in Fahrenheit instead of Celsius, use -f parameter.
Example:
sudo sensors -f
Sample output:
acpitz-virtual-0
Adapter: Virtual device
temp1:       +137.3°F  (crit = +183.2°F)

coretemp-isa-0000
Adapter: ISA adapter
Physical id 0: +141.8°F  (high = +176.0°F, crit = +185.0°F)
Core 0:        +141.8°F  (high = +176.0°F, crit = +185.0°F)
Core 1:        +140.0°F  (high = +176.0°F, crit = +185.0°F)
Use Lm-sensors plugins
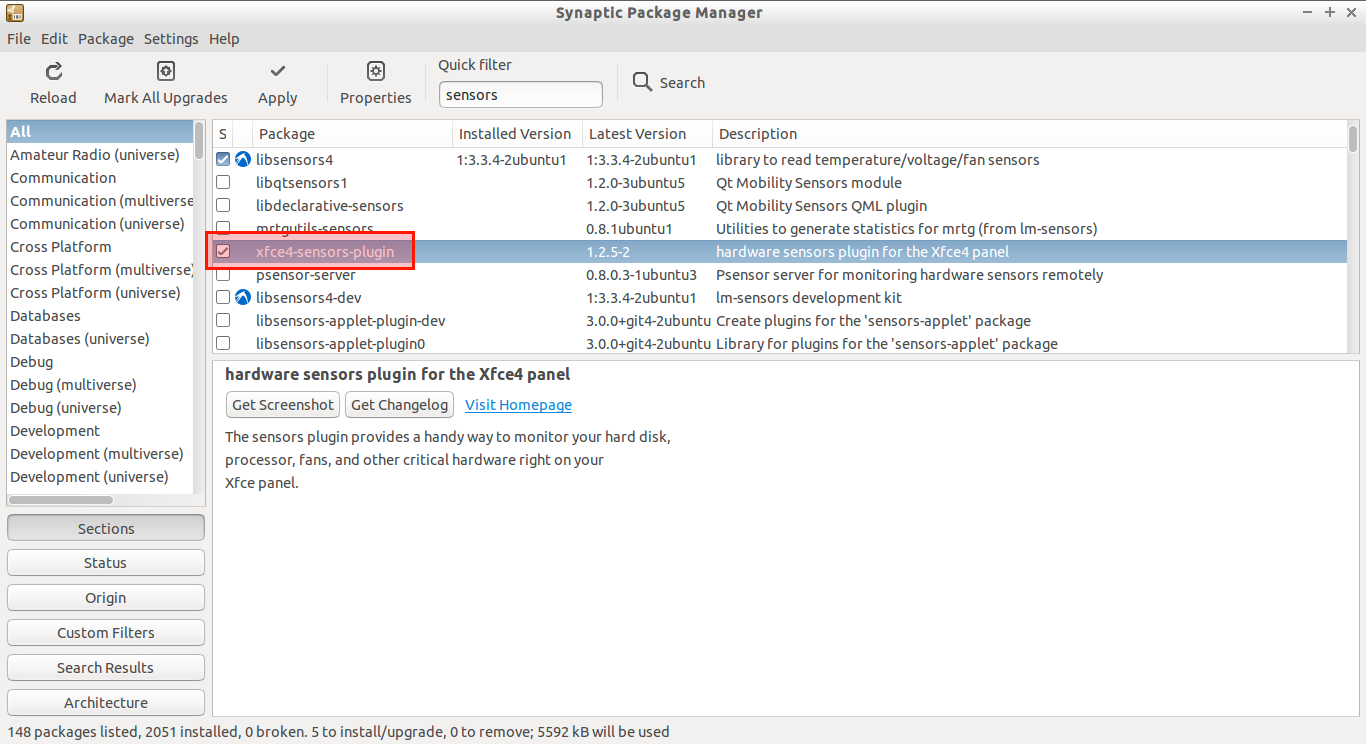
Also, lm-sensors plugins are available for various desktop environments like GNOME, LXDE, XFCE. If you want to monitor your GUI desktop, you can download and install these plugins. These plugins can be installed via Synaptic package manager.
For example, to install plugin for XFCE desktop, open Synaptic package manager, search for XFCE4-sensors-plugin, and install it.
For LXDE desktops, you can download and install sensors plugin here.
Want to check your hard disk temperature?
Install hddtemp package:
sudo apt-get install hddtemp
And, run the following command to find the temperature of your Hdd.
sudo hddtemp /dev/sda
Sample output:
/dev/sda: ST9500325AS: 41°C
Watching Temperature
To watch temperature values updating every two seconds, run the following command:
sudo watch sensors
Sample output:
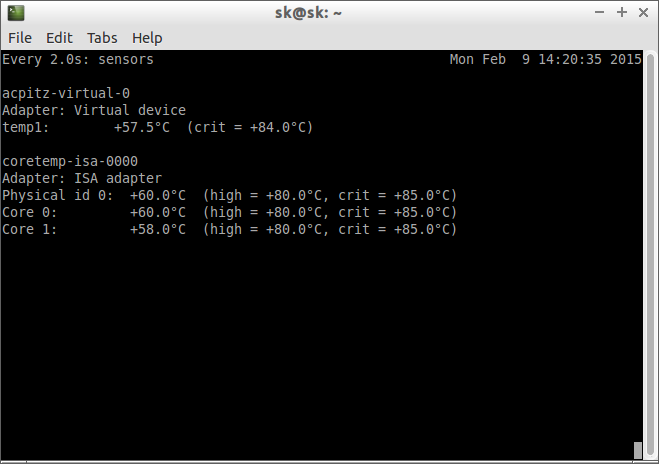
As you see in the above output, the temperature values will be updated after each 2 seconds.
That’s it. Cheers!


