
From the Atop project page,
Atop is an ASCII full-screen performance monitor that is capable of reporting the activity of all processes (even if processes have finished during the interval), daily logging of system and process activity for long-term analysis, highlighting overloaded system resources by using colors, etc. At regular intervals, it shows system-level activity related to the CPU, memory, swap, disks and network layers, and for every process (and thread) it shows a.o. the CPU utilization, memory growth, disk utilization, priority, username, state, and exit code.
Features
Atop has the following notable features over other system monitoring tools.
- Displays the details of active/finished processes during the interval.
- Displays the utilization of cpu and memory/swap, disk I/O and network utilization counters on system-level.
- It will save the log details of resource utilization. You can refer the old logs if you want them later.
- It highlights the critical resource usages.
- It displays the resource consumption of each thread within the process.
- It is possible to accumulate the resource consumption for all processes per user/program.
- It displays the process-level counters concerning the number of TCP and UDP packets transferred, and the consumed network bandwidth with the help of kernel module neatop.
- And many more..
In this tutorial, let us discuss how to install Atop on Linux and how to use it.
Install Atop
On RPM based systems:
Atop will not be found in the official repositories of CentOS/RHEL/Scientific Linux. So let us enable EPEL repository first. To install and enable EPEL repository, refer the following link.
Now, install Atop using the following command:
yum install atop
On Debian based systems:
sudo apt-get install atop
Usage
Atop usage is fairly simple and straight forward as like the usage of the traditional ‘top’ command. Just enter ‘atop’ in the terminal with root privileges and hit enter key.
sudo atop
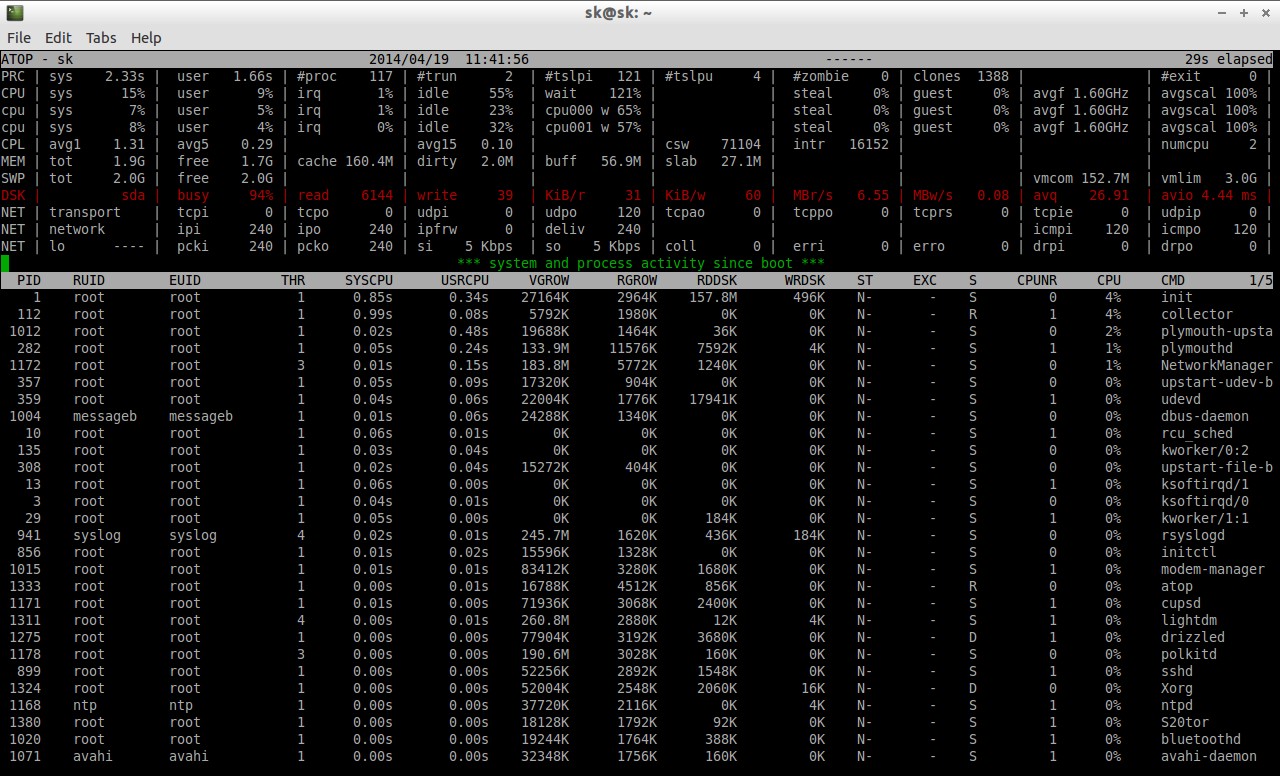
Sample output:
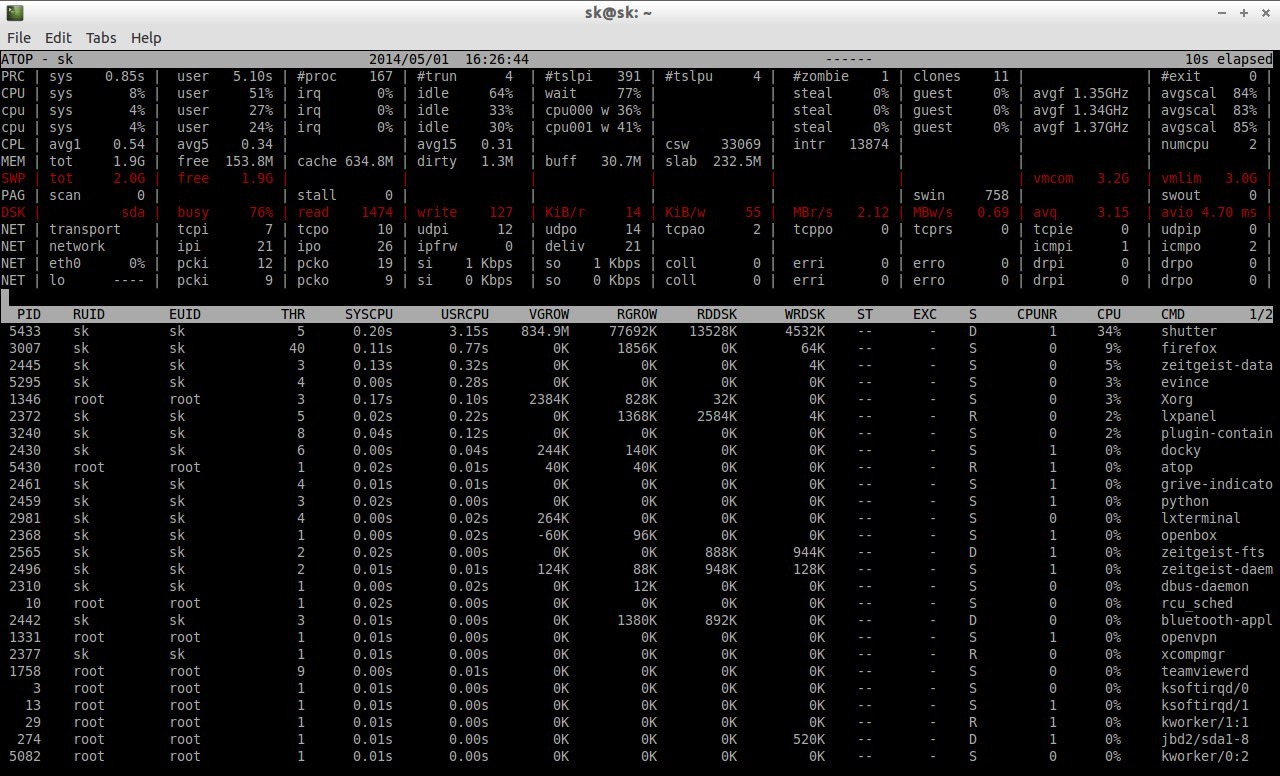
As you see in the above screenshot, the Atop command will display the following details. The result will be split and shown in two sections. The top section shows the following details.
PRC:
PRC section displays the following details:
- Total CPU time consumed, both in system and user mode.
- The total number of current processes (#proc).
- The total number of current running threads (#trun).
- The total number of current sleeping interruptible threads (#tslpi).
- The total number of current sleeping uninterruptible threads (#tslpu).
- The number of zombie processes (#zombie).
- The number of clone system calls (clones).
- The number of processes that ended during the interval (#exit).
CPU:
CPU section displays the CPU utilization, both in system and user modes.
CPL:
CPL section displays the CPU load, both in system and user modes. These values are averaged over 1 (avg1), 5 (avg5) and 15 (avg15) minutes.
MEM:
MEN section displays the memory usage.
SWP:
SWP section displays the Swap memory usage. As you see in the above screenshot, my swap usage is being showed in red colour which means swap is out of space.
DSK:
This section displays the total disk usage of your system.
NET:
It displays usage of all network interface cards in your system.
The bottom window section displays the list of all active processes. To exit from Atop, press ‘q’ without quotes.
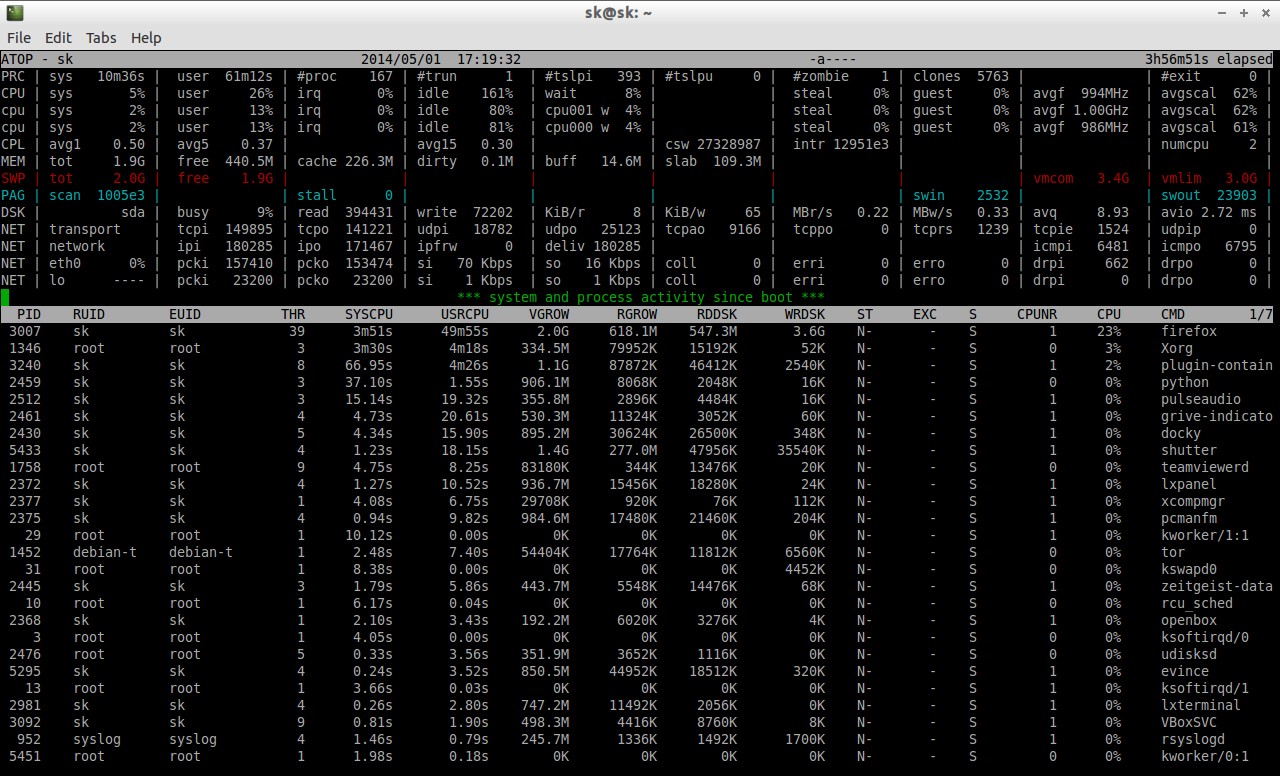
To display, the active processes only, enter the following command:
sudo atop -a
Sample output:
To display general proces info, use the option ‘-g’.
sudo atop -g
To display the memory usage information, use the option ‘m’.
sudo atop -m
To display the network usage information, use the option ‘n’.
sudo atop -n
To display the disk usage related information, use the option ‘d’.
sudo atop -d
Alternatively, you can use the following keys for the above commands to get the relevant details.
- Key g – General process information
- Key m – Memory usage
- Key n – Network usage
- Key d – Disk usage
Atop not only displays the resource usage, but also it maintains the system activity logs.
For example, to view the system activity log today, enter the following command:
sudo atop -r
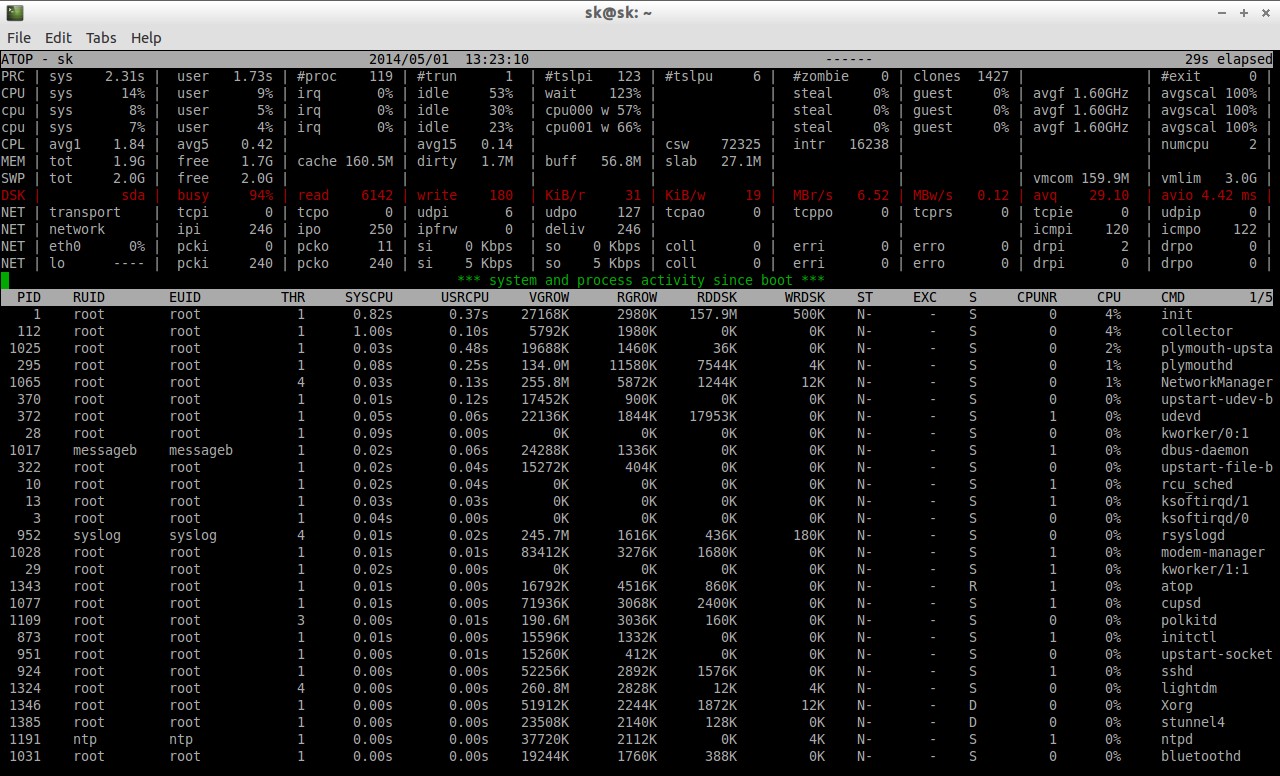
You can move forward and backward through the system activity results using letters ‘t’(small) and ‘T’(Caps). For example, if you want to move forward through the results, press ‘t’. Like wise, to move backward press ‘T’.
Moreover, you can shortlist the results at a specific interval. For example, to view the system activity at 9am, enter the following command:
sudo atop -r -b 9:00
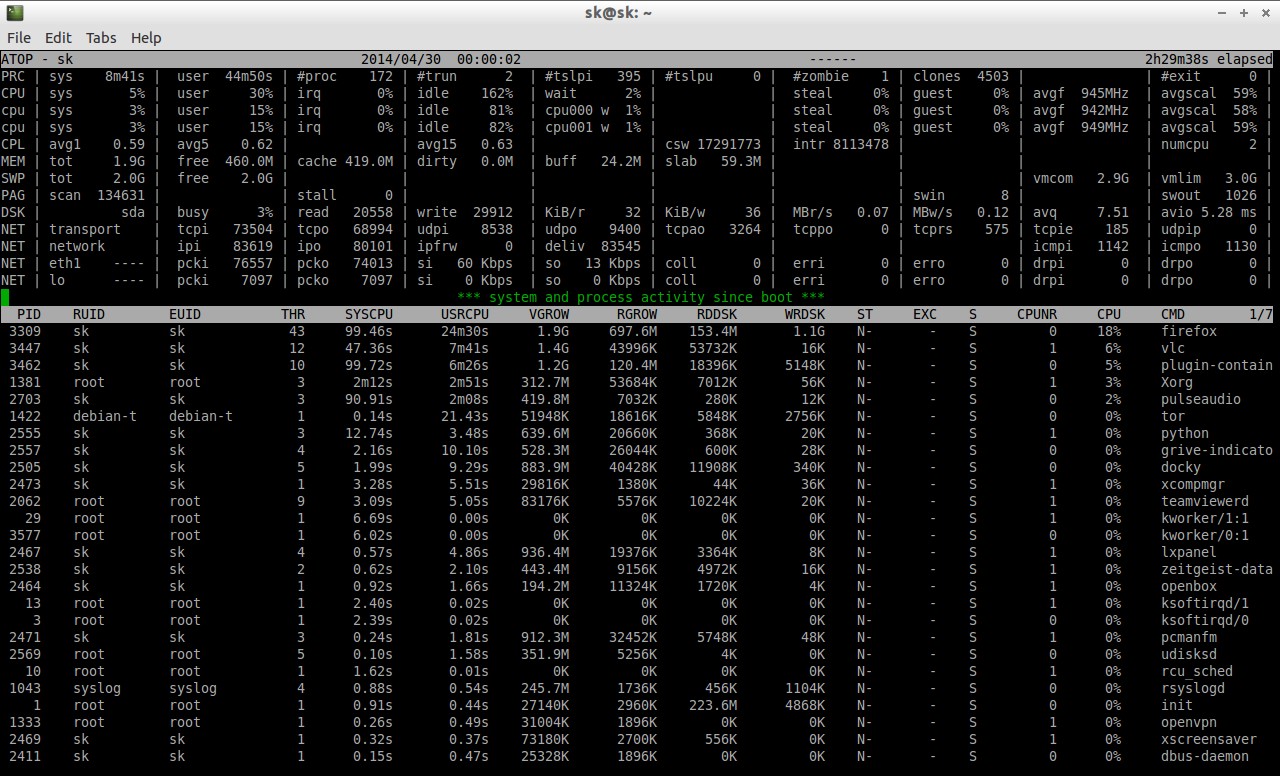
To view the yesterday activity, enter the following command:
sudo atop -r y
Sample output:
Similarly, you can view the system activity for the day before yesterday, use ‘yy’ parameter.
sudo atop -r yy
All system activity logs will be stored in the directory /var/log/atop/. You can search through the directory and can fetch a particular day activity.
ls /var/log/atop/
Sample output:
top_20140412  atop_20140414  atop_20140416  atop_20140418  atop_20140420  atop_20140428  atop_20140430  daily.log
atop_20140413  atop_20140415  atop_20140417  atop_20140419  atop_20140421  atop_20140429  atop_20140501
Say for example, you want to view the system activity on April 19th, 2014, enter the following command:
sudo atop -r /var/log/atop/atop_20140419
Sample output:
That’s it. Refer the project home page and man pages more details instructions.
man atop
Source:


