
Introduction
Barring manufacturing defects, hardware is designed so that its temperature does not exceed maximum operating temperature. But even without any hardware fault, overheating can occur due to various software issues, e.g., buggy graphics card driver, misconfigured fan control program, malfunctioning CPU frequency scaling daemon, etc. Overheating may become serious enough to cause permanent damage on your hardware. So watch out for any overheating issue in your system. Even better, have temperature monitoring system in place, so that you will be alerted if system temperature suddenly goes up. Currently, you are not supposed to be worried about the temperature of your computer. Psensor solves this problem.
Psensor is a GTK+ (Widget Toolkit for creating Graphical User Interface) based application software. It is one the simplest application to monitor hardware temperature and plot Real Time graph from the obtained data for quick review. In this article we will show you how you can monitor system temperature on Linux using Psensor.
Features of Psensor
Psensor is a graphical hardware temperature monitor for Linux. It is characterized by various features where we list the following ones:
- Show Temperature of motherboard, CPU, GPU (Nvidia), Hard Disk Drives.
- Show CPU fan speed.
- Psensor is capable of showing remote server Temperature and Fan Speed.
- Show CPU usages, as well.
- Infact Psensor will detect any supported Hardware and report the Temperature as text and over graph, automatically.
- All the temperatures are plotted in one graph.
- Alarms and Alerts ensures you don’t miss a critical System Hardware Temperature and Fan Speed related issues.
- Easy to Configure. Easy to use.
- it monitors the temperature of ATI/AMD GPUs
- And it monitors the rotation speed of the fans (using lm-sensors).
The application is designed to be simple and easy to use. The CPU and memory consumption are not significant. Psensor is released under GPLv2 license terms.
Installation of psensor on Linux
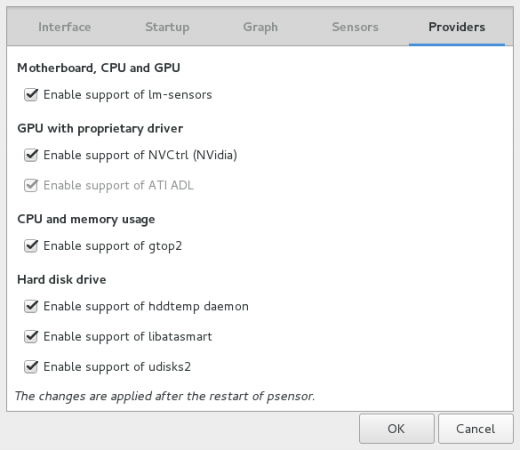
Psensor depends on other tools such such lm-sensors and hddtemp. Thus you need to install psensor along with those prerequisites.
First we will install them using the following command:
With Debian or Ubuntu:
$ sudo apt-get install lm-sensors hddtemp psensor
With Fedora:
$ sudo yum install lm_sensors hddtemp
$ sudo yum install gcc gtk3-devel GConf2-devel lm_sensors-devel cppcheck libatasmart-devel libcurl-devel json-c-devel libmicrohttpd-devel help2man libnotify-devel libgtop2-devel make
$ wget http://wpitchoune.net/psensor/files/psensor-0.8.0.3.tar.gz
$ tar xvfvz psensor-0.8.0.3.tar.gz
$ cd psensor-0.8.0.3
$ ./configure
$ make
$ sudo make install
You can also install Psensor Server using the following command, to note that this server could be used just with Debian system:
# apt-get install psensor-server
Then you can start the detection of your hardware sensors using the following command:
sudo sensors-detect
And to verify that it works use the following command:
sensors
You will get something like the following:
coretemp-isa-0000
Adapter: ISA adapter
Core 0: +49.0C (high = +77.0C, crit = +102.0C)
coretemp-isa-0001
Adapter: ISA adapter
Core 1: +45.0C (high = +77.0C, crit = +102.0C)
...
Then run Psensor from the desktop application menu to get the graphical control like the following:
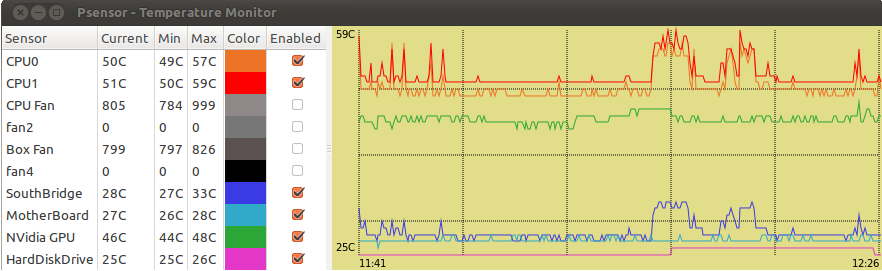
Psensor use the Celsius unit by default. You can convert the unit if you have installed the newest version of Psensor.
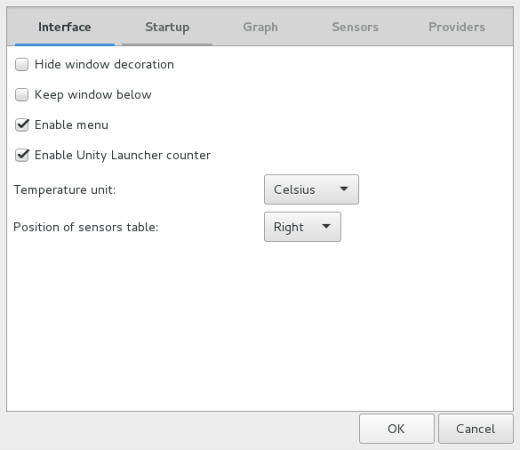
Now we will show you how you can customize your Psensor. So go to the Menu Psensor > Preferences > Interface. You can now easily use the different options from the interface customization
Then go to Menu Psensor > Preferences > Startup where you can make some configuration:
If you do want it to run on startup, in its Preferences (not Sensor Preferences!), click on the Startup tab and then enable “Launch on session startup”. If you don’t want the Psensor window to be displayed on startup (for instance, you only want the indicator to start automatically – you can manually open the Psensor window later on), also enable “Hide window on startup”.
You can even change the colors representing the individual sensors in the graph. In addition, each sensor has a checkbox available under the Graph column. Checked graphs will appear in the graph while unchecked sensors are hidden. Checking and unchecking sensors does not reset the acquired temperature data.
Conclusion
Psensor is quite useful for displaying temperatures, which is something the regular system monitors usually do not handle. It will try to recognize the hardware temperature sensors in your system automatically, so it can only report the temperatures of the hardware it detects.


