Introduction
In our previous article, we discussed how to install and configure Elasticsearch tool in Ubuntu 14.04 . Let us move one step ahead with Kibana. First of all we have to understand what is the need of this trinity of ELK (Elasticsearch, Logstash and Kibana). Every application and device produce logs in its own style. When your application grow beyond a single machine then you will need some central space to log and monitor what’s going on. Logstash and elasticsearch stores logs in structured way and kibana is a web front to search and aggregate your logs. Basically, Kibana is visualization and exploration of elasticsearch data. It is a single page javascript application to search and analyze time based data in elasticsearch.
Features
Gives shape to your data:
It is an analytics and visualization platform designed to work with elasticsearch, it comes with web based interface which makes easy to analyze data in the from of Tables, Charts and Maps.
Democratization of log data:
Democratize log data so that different type of users e.g. marketing or sales team can visualize or utilize the data as per their requirements and formats.
Easy setup:
Expertise are required as non-expert do not know where the log data is, how to understand the log data, and they do not have access to read to logs. as the size of log data increases it becomes more and more complex format. Even a non expert users can also analyze data easily with kibana.
Enable searching in faster way:
this democratization must me fast and retrieve results using powerful analytics tools to summarize data in many formats and dimensions,it enable searching in faster and meaningful way.
Install Kibana
Download Kibana from the following link.
root@user:~# wget https://download.elastic.co/kibana/kibana/kibana-4.1.1-linux-x64.tar.gz
Unzip the kibana package:
root@user:~# gunzip kibana-4.1.1-linux-x64.tar.gz
Extract kibana.x.x.x.tar package:
root@user:~# tar -xvf kibana-4.1.1-linux-x64.tar
Edit ~/kibana-4.1.1-linux-x64/config/kibana.yml:
root@user:~/kibana-4.1.1-linux-x64/config#vim kibana.yml
search for host: “0.0.0.0″ and replace with host: “localhost”
Sample output:
Kibana is served by a back end server. This controls which port to use.
port: 5601
# The host to bind the server to.
host: "localhost"
# The Elasticsearch instance to use for all your queries.
elasticsearch_url: "http://localhost:9200"
#elasticsearch_url: "http://192.168.1.50:80"
# preserve_elasticsearch_host true will send the hostname specified in `elasticsearch`. If you set it to false,
# then the host you use to connect to *this* Kibana instance will be sent.
elasticsearch_preserve_host: true
# Kibana uses an index in Elasticsearch to store saved searches, visualizations
# and dashboards. It will create a new index if it doesn't already exist.
kibana_index: ".kibana"
# If your Elasticsearch is protected with basic auth, this is the user credentials
@
Create a directory with name “kibana” in /opt:
root@user:~/kibana-4.1.1-linux-x64/config#mkdir /opt/kibana
Copy each and everything from kibana-4.1.1-linux-x64 folder to /opt/kibana:
root@user:~ cp -Rrvf kibana-4.1.1-linux-x64/* /opt/kibana/
Download init.d script for kibana service.
root@user:~# cd /etc/init.d/
root@user:/etc/init.d# wget https://gist.githubusercontent.com/thisismitch/8b15ac909aed214ad04a/raw/bce61d85643c2dcdfbc2728c55a41dab444dca20/kibana4
Change permissions accordingly and run kibana service:
root@user:/etc/init.d# chmod +x /etc/init.d/kibana4
root@user:/etc/init.d# update-rc.d kibana4 defaults 96 9
root@user:/etc/init.d# /etc/init.d/kibana4 restart
Check whether Kibana is working or not.
Open your web browser and navigate to: http://127.0.0.1:5601
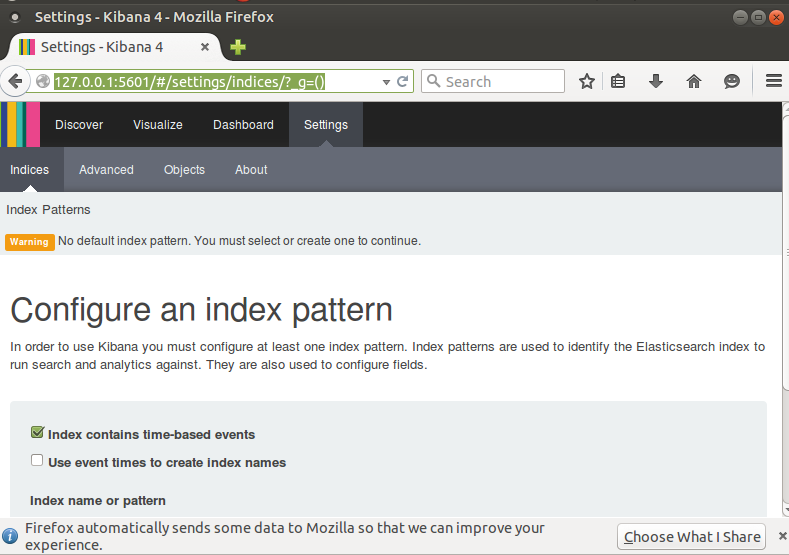
Installation of Kibana is completed. We will continue with logstash in next article, till then have fun!!
Reference link:


