
Hello Everyone. In our today’s article we will be going to setup Etherape on Ubuntu 16.04. EtherApe is a packet sniffer/network traffic monitoring tool, developed for Unix/Linux modeled after etherman. EtherApe is free, open source software developed under the GNU General Public License. It displays network activity graphically. Hosts and links change in size with traffic and displays color coded protocols. It supports Ethernet, FDDI, Token Ring, ISDN, PPP, SLIP and WLAN devices, plus several encapsulation formats. It can filter traffic to be shown, and can read packets from a file as well as live from the network.
So, if you ever wished that you could find who is using your home network bandwidth then simply follow this article and start using Etherrape. I will show you how to get EtherApe up and running and how to customize it to fit your needs.
System Update
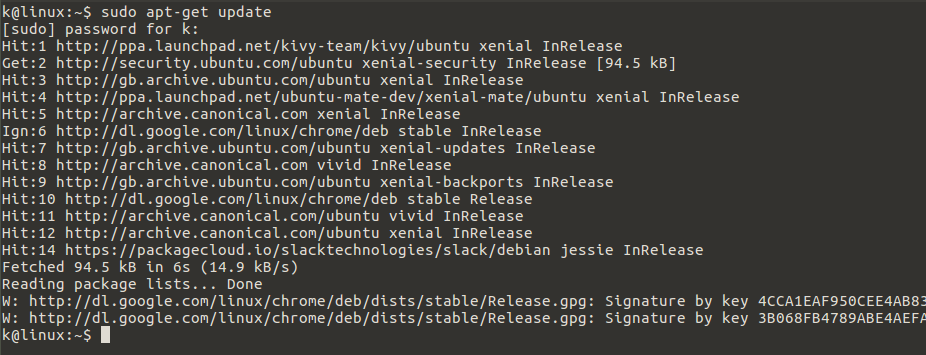
Before we start installing installing Ethrape on our Ubuntu 16.04 LTS, we need to update our system with latest update and other security updates. To do so, open your command line terminal and flow the command below.
[cc]$ sudo apt-get update [/cc]
Installing EtherApe
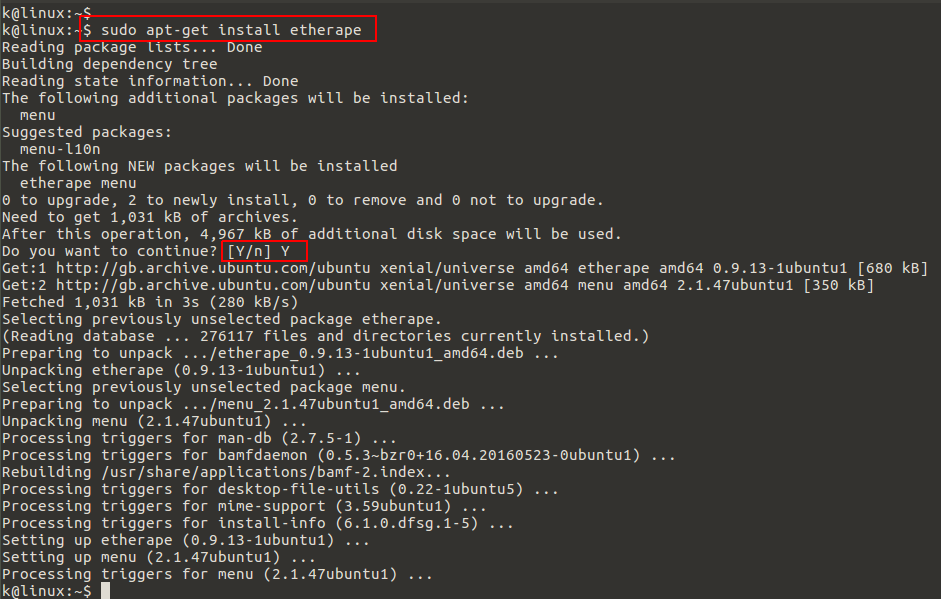
Installing EtherApe on Ubuntu is simple and just a one command command away on Ubuntu 16 . It will be installed by using simple below command, then press ‘y’ key to continue.
[cc]$ sudo apt-get install etherape [/cc]
Starting EtherApe
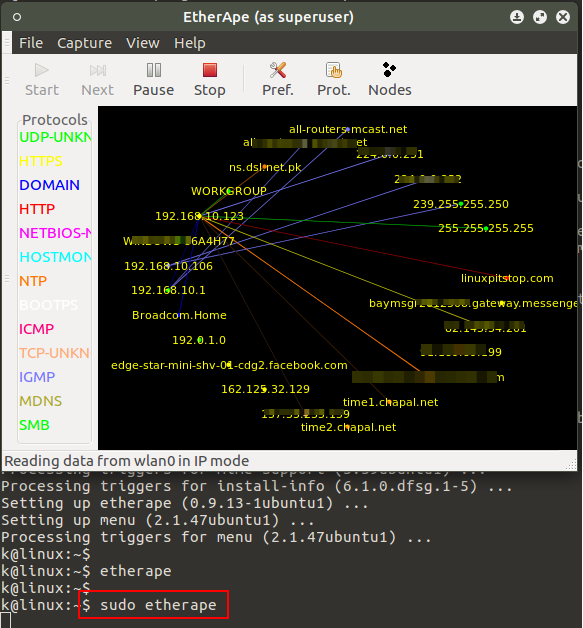
After installation, you can start EtherApe on your your Ubuntu server from your desktop under Applications or use below command to start EtherApe on your system.
[cc]$ sudo etherape[/cc]
After this you get its console opened in your desktop looks like the image below.
Configuring EtherApe
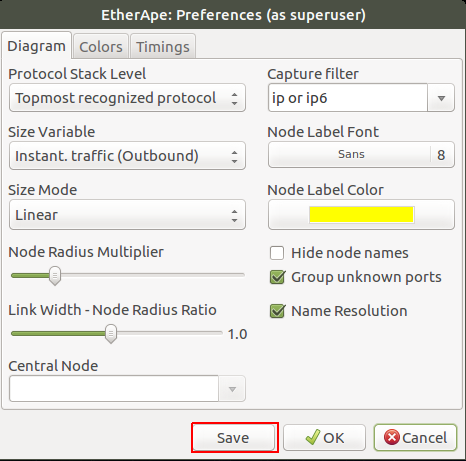
You can customize the use of EtherApe network monitoring, if you have more than one interface like wlan0, eth0, eth1 and others then you can configure it by clicking on “Capture >> Interfaces” and select the interface that you want to perform the network monitoring for you.
You can also create filters for your monitor, from the options top bar selecting ”File >> Preferences”. Here you can make you suitable changes under diagram, coloring scheme and timings and then click on ‘save’ button to implement changes.
Reading From Files
Etherape can read files from the tcpdump application. But you must run tcpdump with the ‘-n’ and ‘-w’ flags. The tcpdump command would be run like as hsown below .
[cc]$ sudo tcpdump -n -w dump_file[/cc]
Once you are satisfied you have enough information you can stop the dump with ‘ctrl-c’. Once you have your dump file you can open it by going to File and then selected Open. The captured packets will display in real time as they were captured during tcpdump’s run.
Another really handy little trick takes advantage of secure shell. You can pipe the output of a tcpdump run through an ssh session. This allows you to actually monitor a remote network with EtherApe. To do this, you must have root permissions on the remote machine and must run a command as shown below.
[cc] # ssh remote server_ip -l root /usr/sbin/tcpdump -n -w | /usr/sbin/etherape -m ip -r [/cc]
After you issue the command to monitor a remote network, you will be asked for the root user password. Once the root password is entered, EtherApe will open displaying the remote network traffic.
Understanding EtherApe Colors and Protoclos
If click on ”View >> Protocols” then you will be able to see the multiple protocols and colors on the left side of your screen. Each protocol will be representing the equivalent color. You can see different stats that each protocol is listening on which port and what amount of traffic is being generated.
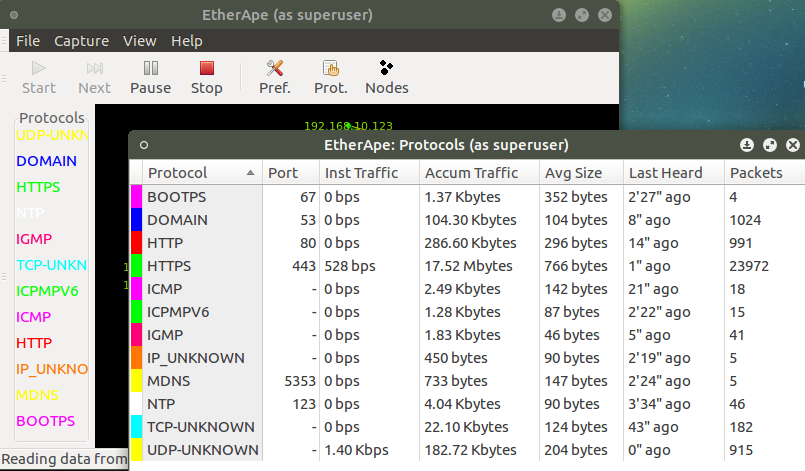
The Protocols window is a great tool to use for troubleshooting your network. Suppose your network becomes extremely slow, and you have no idea why. You can use EtherApe to check on the traffic that’s moving through your network. When you fire up EtherApe, you see a Web of traffic. You open the Protocols window and confirm that WWW is racking up an enormous amount of traffic. When you return to the Main window, you see that the vast amount of WWW traffic is hitting one of your backup Web servers and that traffic is coming from one specific domain. You can end this problem by blocking the domain from entering your internal network.
Conclusion
Etherape is a great tool for monitoring network traffic. Not only is it simple to use, it gives you instant output as traffic comes in and out of your network. It provides graphs of all the hosts which are having incoming/outgoing packages with your computer, the software has the capability to create a graph based on all the packages that are being processed on your network interface. So, using the EtherApe you can be able to troubleshoot problems related to your computer security, as Virus, DoS attack, brute force attack, moreover is possible to check why your computer network is slow.


