
About Zabbix
Zabbix is an enterprise-class open source distributed monitoring solution that can be used to monitor and track performance and availability of network servers, devices and other IT resources. It supports distributed and WEB monitoring, auto-discovery, and more.
Install Zabbix Server
I tested this how-to On CentOS 7 minimal server, although it should work on other RHEL/Scientific Linux 7.x versions.
For the testing purpose, I will use two machines.
Zabbix Server System:
- Operating system: CentOS 7 64bit server
- IP Address: 192.168.1.150/24
- Hostname: server1.unixmen.local
Zabbix Client System:
- Operating system: CentOS 7 64bit server
- IP Address: 192.168.1.152/24
- Hostname: server2.unixmen.local
First let us start from server side.
Prerequisites
Before installing Zabbix, we should have install and configure LAMP stack.
To install and configure LAMP server On CentOS 7, refer the following link.
Server Side Configuration
Zabbix is not available in the default repositories of CentOS. So, we will add EPEL and Zabbix official repository in order to install Zabbix server.
To install EPEL repository, run the following command:
yum install epel-release
Configure the ZabbixZone package repository and GPG key using command:
rpm --import http://repo.zabbix.com/RPM-GPG-KEY-ZABBIX
rpm -Uv http://repo.zabbix.com/zabbix/2.4/rhel/7/x86_64/zabbix-release-2.4-1.el7.noarch.rpm
Now, Install Zabbix server and agent using command:
yum install zabbix-server-mysql zabbix-web-mysql zabbix-agent zabbix-java-gateway
Edit file /etc/httpd/conf.d/zabbix:
vi /etc/httpd/conf.d/zabbix.conf
Update your timezone:
php_value date.timezone Asia/Kolkata
Restart the httpd
systemctl restart httpd
Create MySQL database and user for Zabbix
Login to MariaDB prompt with command:
mysql -u root -p
Create a database called ‘zabbixdb’ and database user called ‘zabbixuser’.
Welcome to the MariaDB monitor. Commands end with ; or \g.
Your MariaDB connection id is 10
Server version: 5.5.41-MariaDB MariaDB Server

Copyright (c) 2000, 2014, Oracle, MariaDB Corporation Ab and others.

Type 'help;' or '\h' for help. Type '\c' to clear the current input statement.

MariaDB [(none)]> create database zabbixdb character set utf8;
Query OK, 1 row affected (0.05 sec)

MariaDB [(none)]> grant all privileges on zabbixdb.* to 'zabbixuser'@'localhost' identified by 'password';
Query OK, 0 rows affected (0.21 sec)

MariaDB [(none)]> flush privileges;
Query OK, 0 rows affected (0.00 sec)

MariaDB [(none)]> exit
Bye
Import zabbix templates to Zabbix database
Let us import the following templates. It will ask you the zabbixuser’s password during importing templates.
mysql -u zabbixuser -p zabbixdb < /usr/share/doc/zabbix-server-mysql-2.4.5/create/schema.sql
mysql -u zabbixuser -p zabbixdb < /usr/share/doc/zabbix-server-mysql-2.4.5/create/images.sql
mysql -u zabbixuser -p zabbixdb < /usr/share/doc/zabbix-server-mysql-2.4.5/create/data.sql
Configure Zabbix server
Edit file /etc/zabbix/zabbix_server.conf,
vi /etc/zabbix/zabbix_server.conf
Set the database name, user and password which you’ve created earlier. If the lines are commented out, uncomment and set the correct values.
[...]
DBName=zabbixdb
[...]
DBUser=zabbixuser
[...]
DBPassword=password
[...]
Save and close the file.
Now, we have to set Zabbix server to monitor itself.
To do that, edit file /etc/zabbix/zabbix_agentd.conf,
vi /etc/zabbix/zabbix_agentd.conf
Do the following changes.
[...]

## Line 85 - Specify Zabbix server ##
Server=127.0.0.1

[...]

## Line 126 - Specify Zabbix server ##
ServerActive=127.0.0.1

[...]

## Line 137 - Specify Zabbix server Hostname or IP address ##
Hostname=server1.unixmen.local
[...]
Save and close the file.
Adjust PHP settings
We should adjust phip.ini file as per zabbix recommended settings.
Edit file php.ini,
vi /etc/php.ini
Set the values as shown below. If the lines doesn’t exist, add them.
max_execution_time = 600
max_input_time = 600
memory_limit = 256M
post_max_size = 32M
upload_max_filesize = 16M
date.timezone = Asia/Kolkata
Save and close the file.
Adjust Firewall and SELinux settings
Adjust iptables to allow the zabbix ports 10050 and 10051.
firewall-cmd --permanent --add-port=10050/tcp
firewall-cmd --permanent --add-port=10051/tcp
Restart iptables service to take effect the changes.
systemctl restart firewalld
If you use SELinux, run the following command to allow Apache to communicate with Zabbix.
setsebool -P httpd_can_connect_zabbix=1
Allow Zabbix web console for particular IP range (Optional)
Edit file /etc/httpd/conf.d/zabbix.conf,
vi /etc/httpd/conf.d/zabbix.conf
Add the ip range that you want to allow to access zabbix web interface. This is optional. If you set ‘Allow from All’, you can access zabbix’s web console from any network.
In my case, I allowed the 192.168.1.0/24 series.
Alias /zabbix /usr/share/zabbix

<Directory "/usr/share/zabbix">
 Options FollowSymLinks
 AllowOverride None
 Order allow,deny
 Allow from 192.168.1.0/24
</Directory>
Save and close the file. Start/Restart zabbix and httpd services and make them to start automatically on every reboot.
systemctl start zabbix-server
systemctl start zabbix-agent
systemctl restart httpd
systemctl restart mariadb
systemctl enable zabbix-server
systemctl enable zabbix-agent
Configure Zabbix via Web console
We have completed the installation and configuration part. Now let us configure the zabbix web console.
Navigate tohttp://ip-address/zabbix or http://domain-name/zabbix.
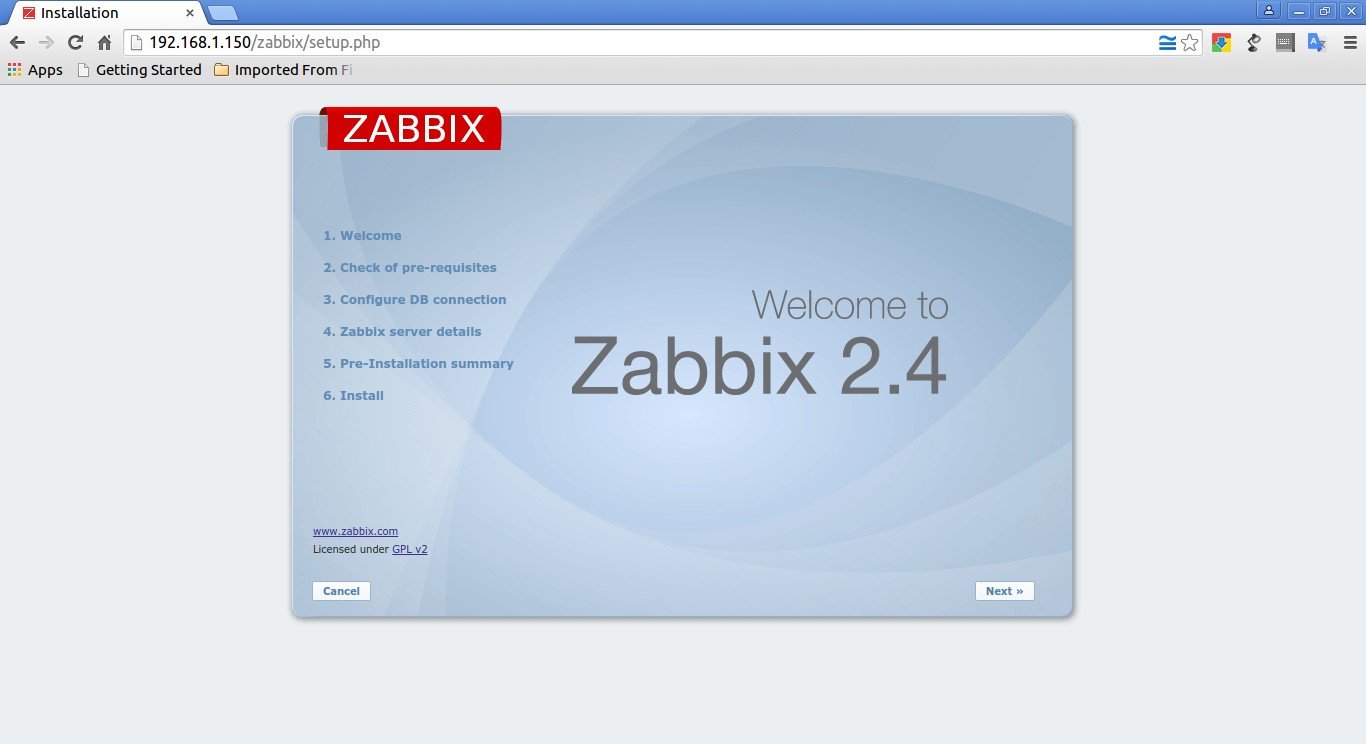
Click Next.
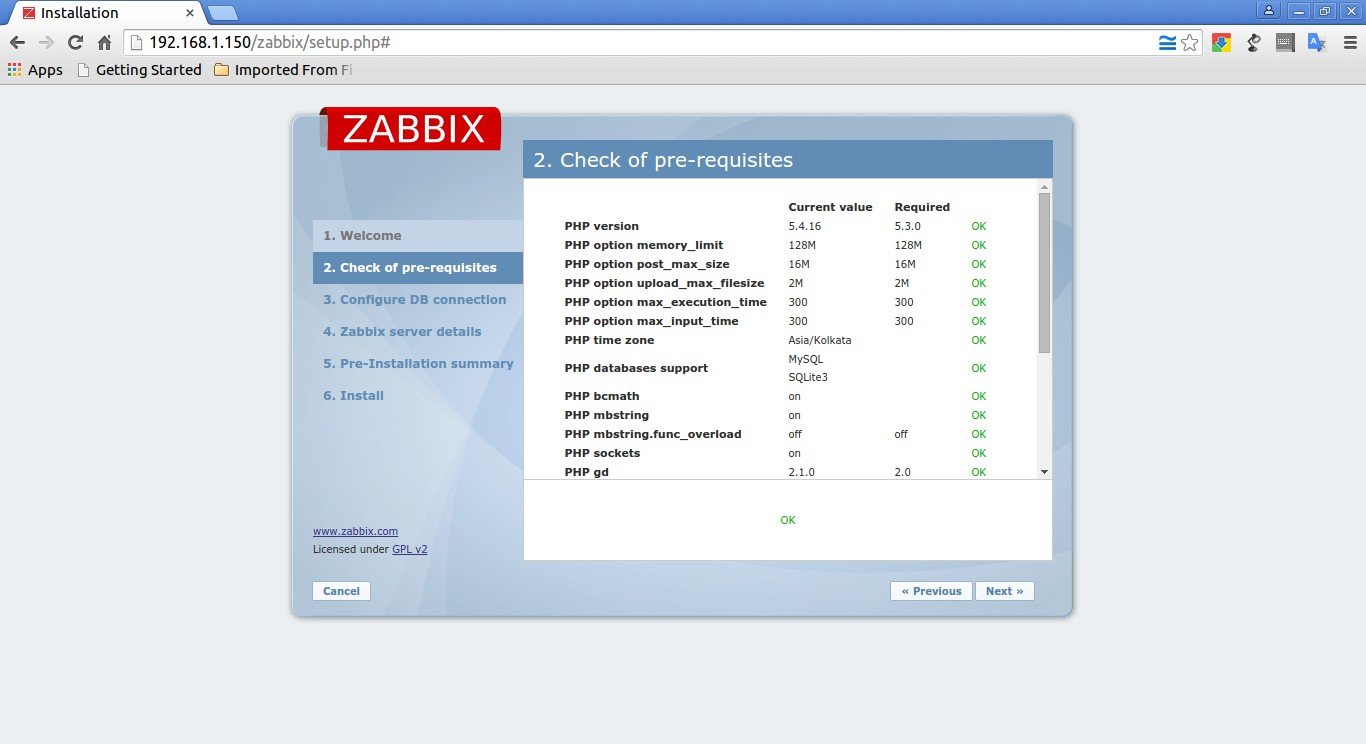
The installer will check for necessary prerequisites. If everything seems OK, click Next to continue, else go back and install the necessary packages.
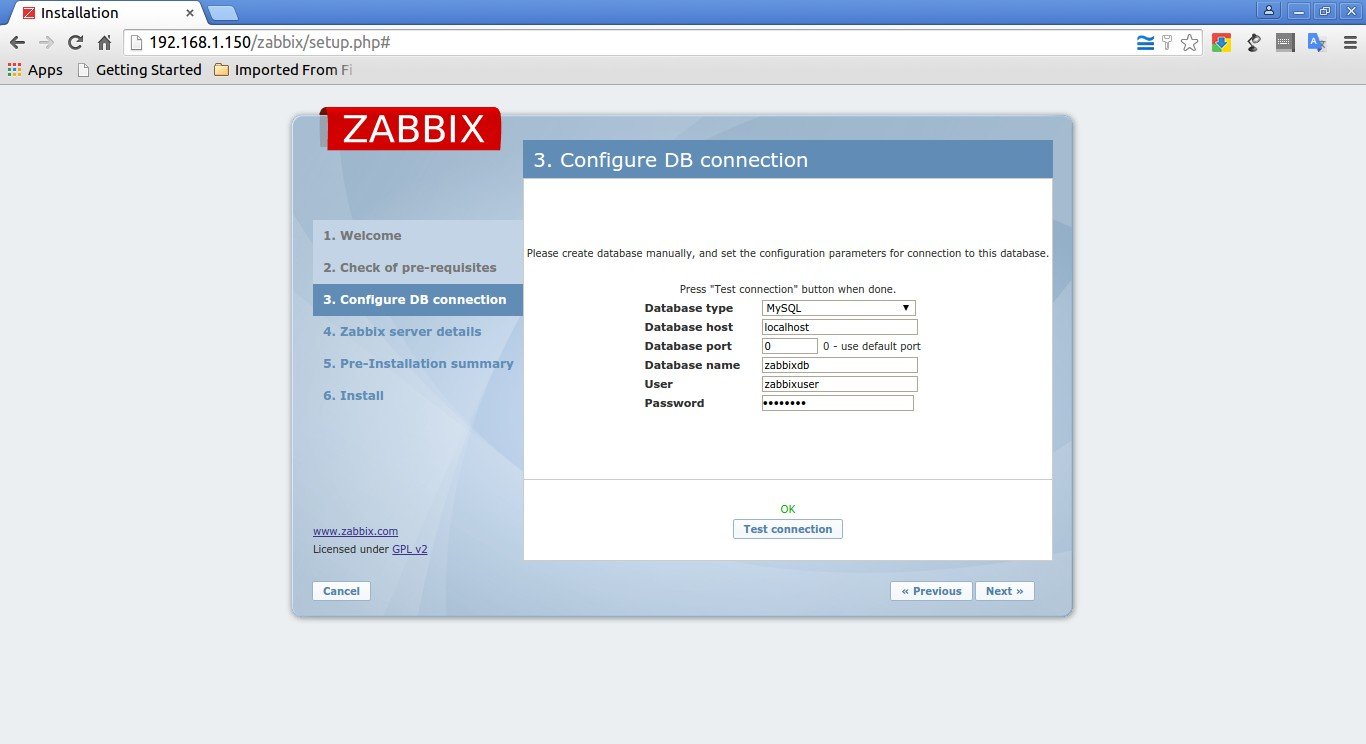
Enter the zabbix database name, database user and password and click Test connection. If you entered the correct values, it will show a message that says: OK.
Click Next to continue.
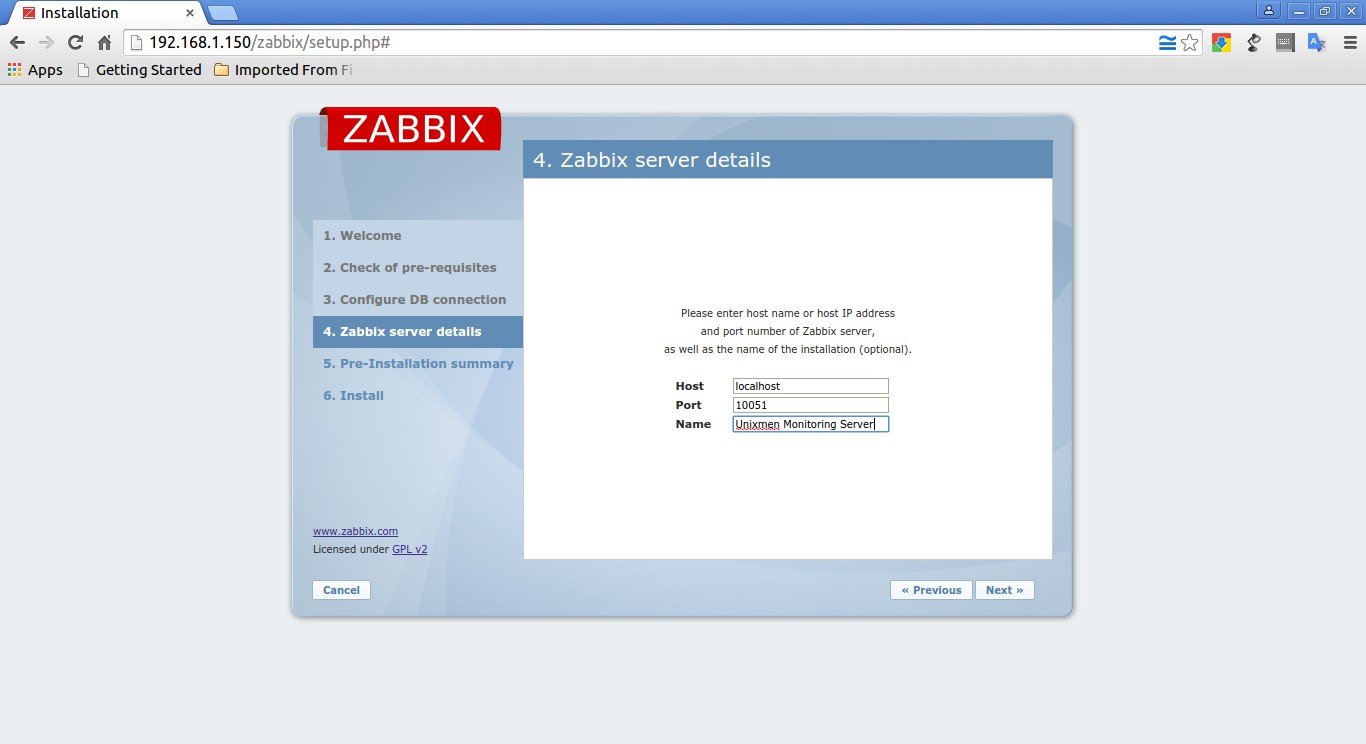
Enter your server name and Click Next:
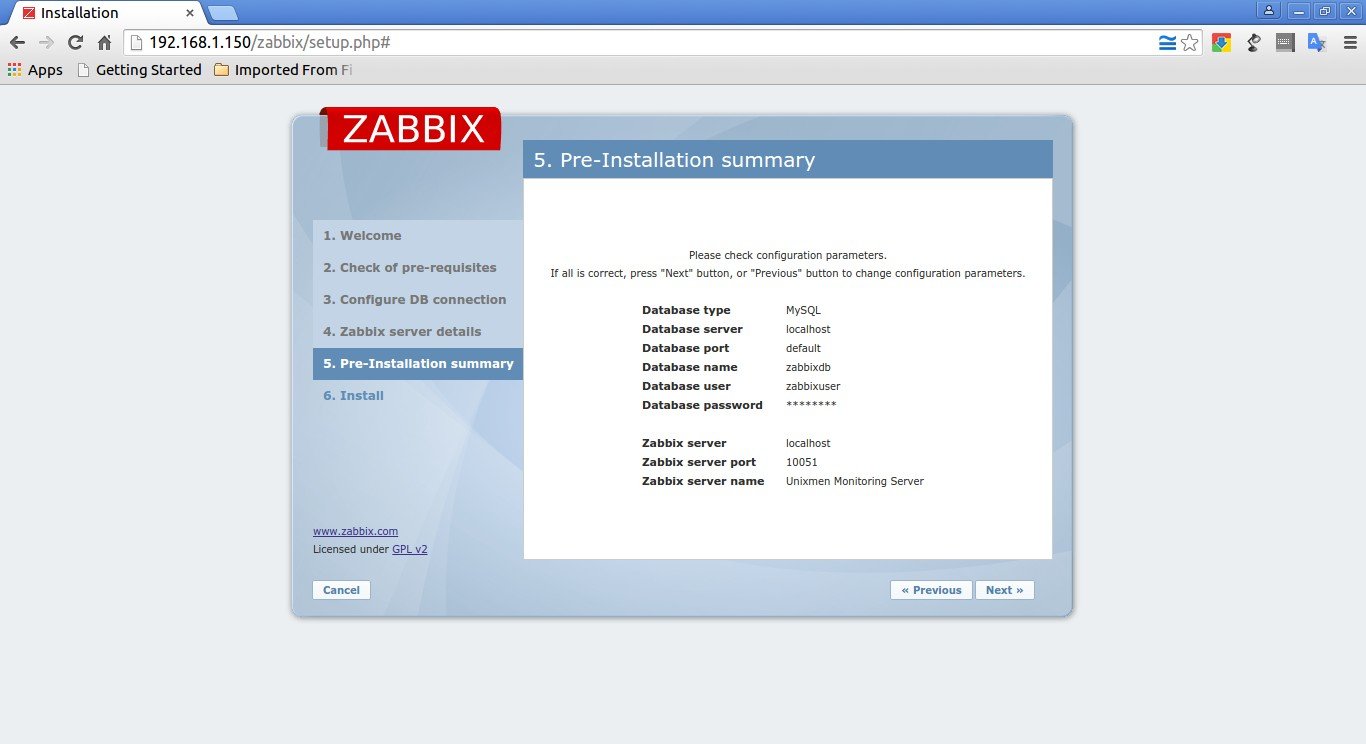
Check the pre-installation summary, if everything good, click Next to continue or click Previous to change the parameters.
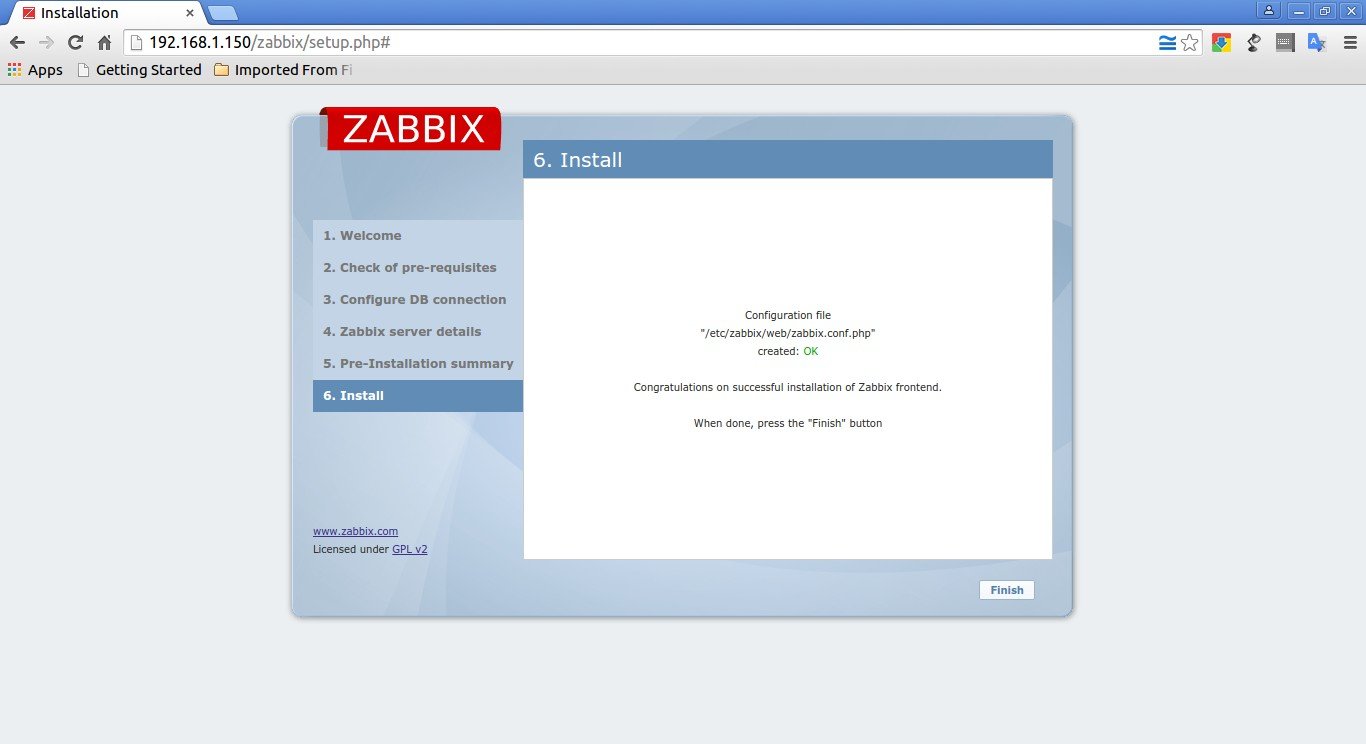
Congratulations! You’ve have successfully completed the installation. Click Finish to complete the installation.
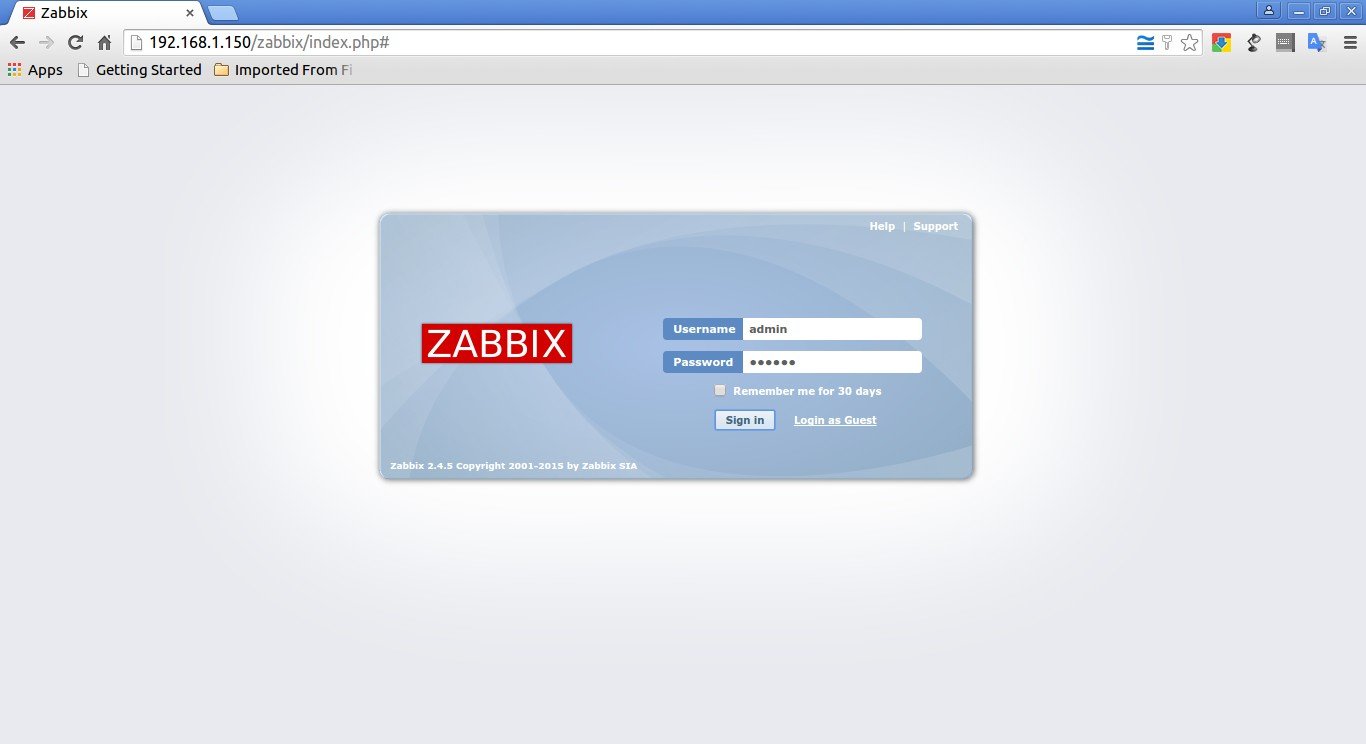
Now you’ll be redirected to the zabbix web console page. Enter the username and password.
The default username/password is admin/zabbix.
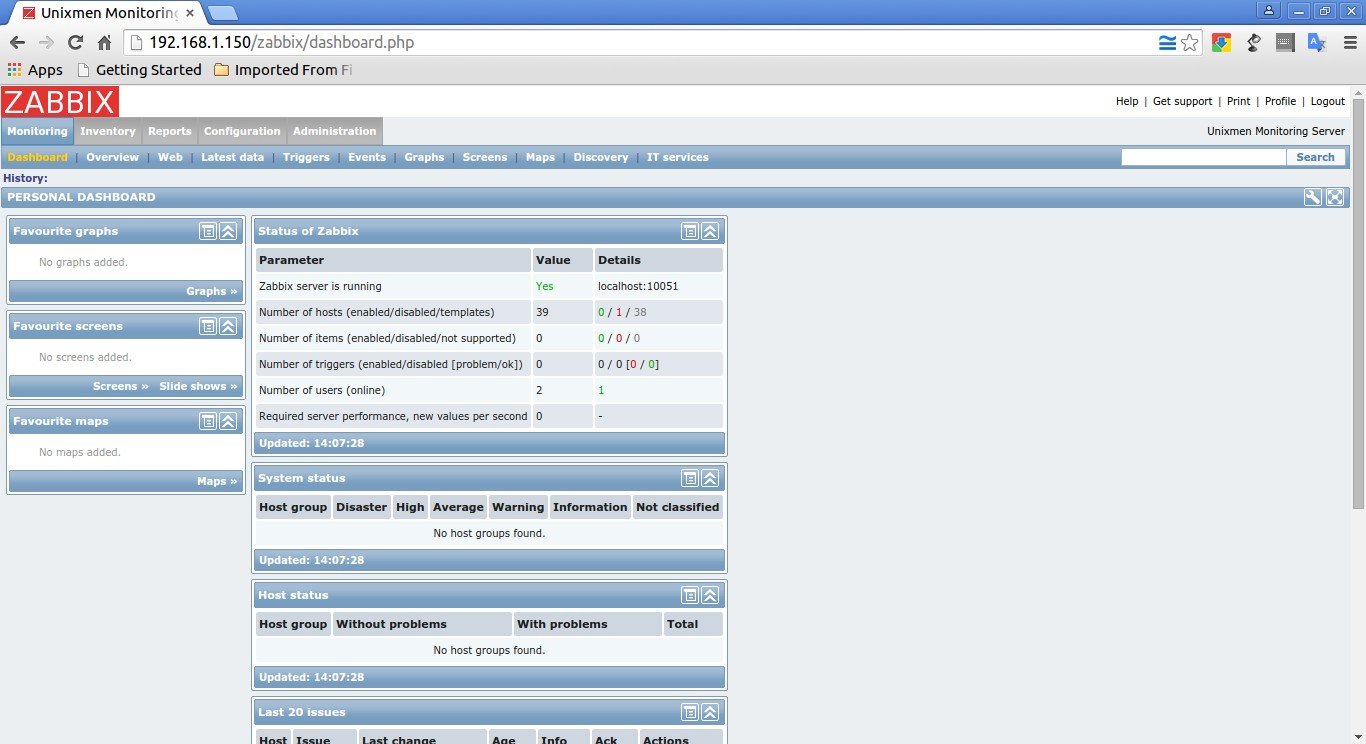
This is how the admin dashboard looks:
Activate Zabbix server
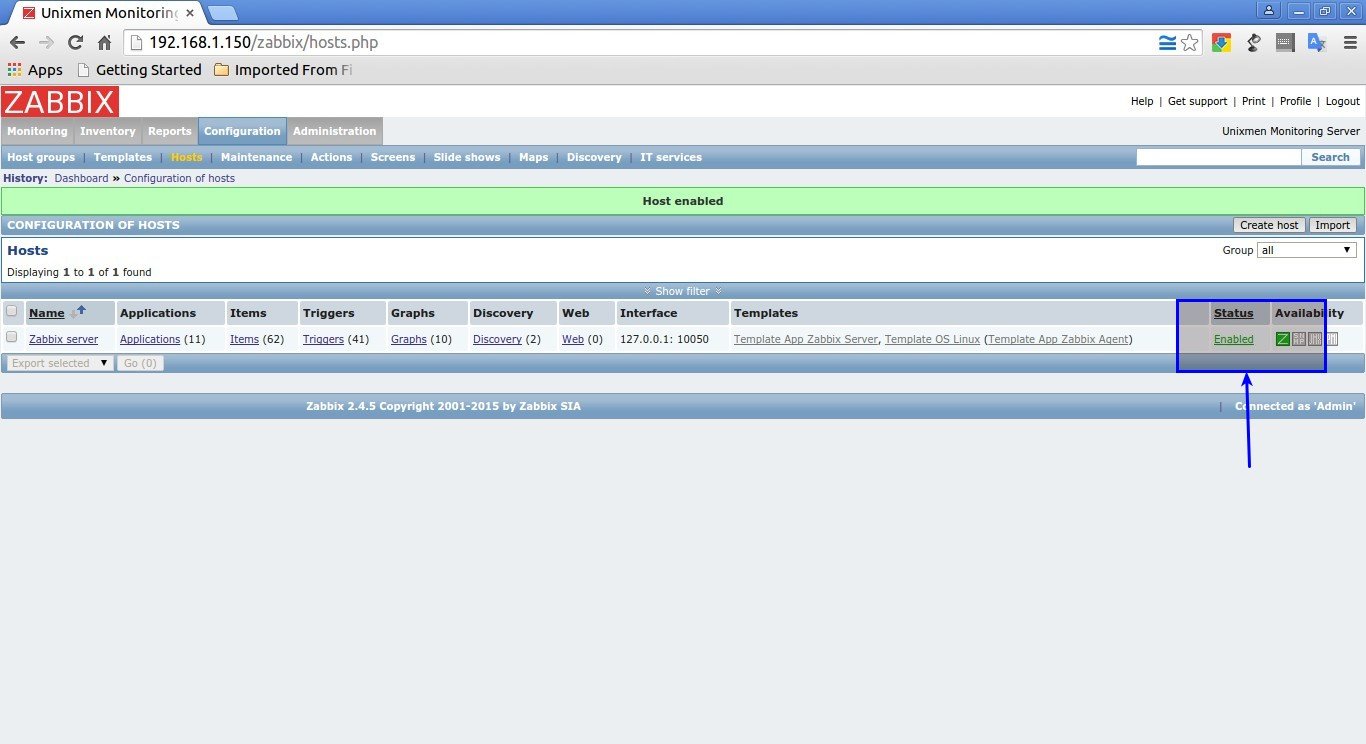
Initially, the zabbix server is deactivated from being monitored.
To activate it, go to Configuration -> Hosts. Select the host (zabbix server) and choose Activate selected from the drop-down box and click Go.
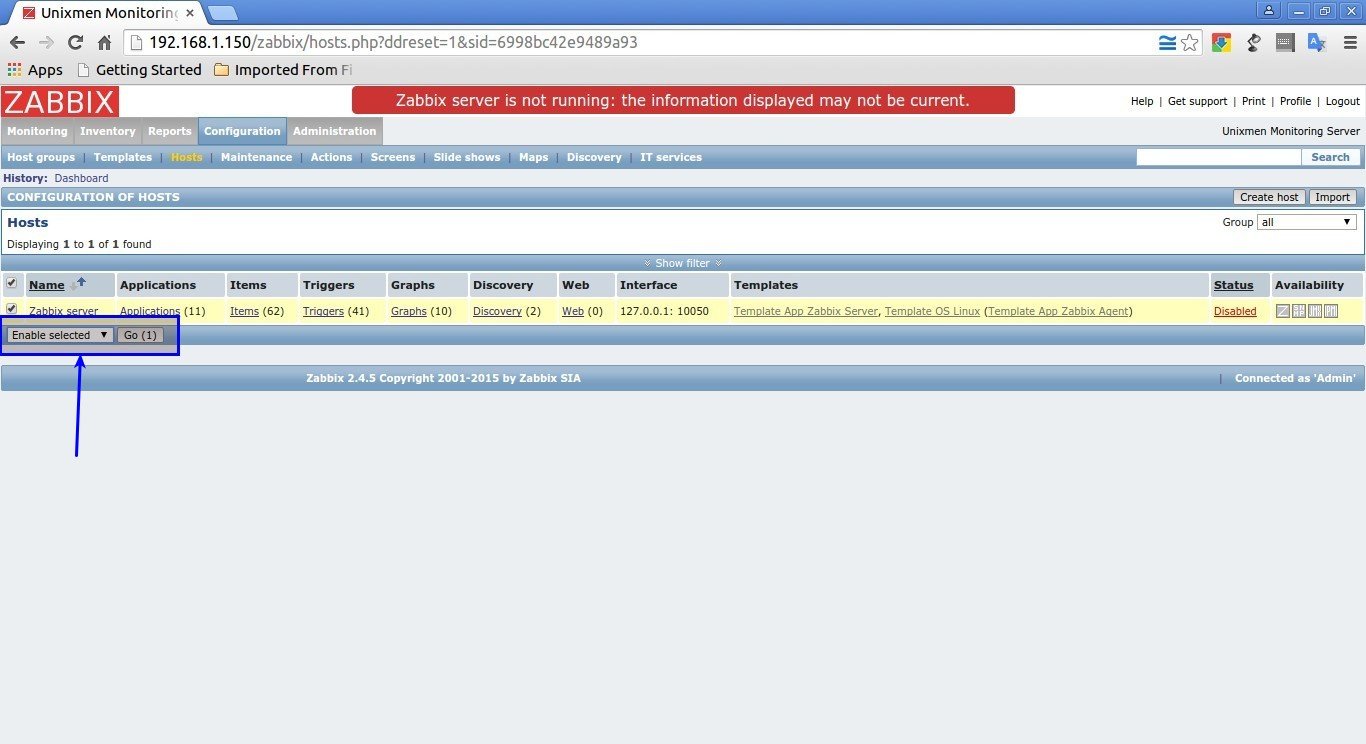
Now, you should see your Zabbix server is being monitored.
Check Zabbix server Statistics
After a few seconds, click on the Monitoring tab on the top menu bar and select “Latest data”.
You’ll see the zabbix server’s details:
![Unixmen Monitoring Server: Latest data [refreshed every 30 sec.] - Google Chrome_002](http://unixmen.com/wp-content/uploads/2015/07/Unixmen-Monitoring-Server-Latest-data-refreshed-every-30-sec.-Google-Chrome_002.jpg)
To view the screens, go to Monitoring -> Screens from the Zabbix’s dashboard.
![Unixmen Monitoring Server: Custom screens [refreshed every 30 sec.] - Google Chrome_003](http://unixmen.com/wp-content/uploads/2015/07/Unixmen-Monitoring-Server-Custom-screens-refreshed-every-30-sec.-Google-Chrome_003.jpg)
That’s it. We’re done in the server side. Let us go to client side configuration.
Client Side Configuration
Let us install zabbix agent on our client systems.
To install zabbix agent packages on Fedora/RHEL clients, enter the following commands in Terminal:
rpm --import http://repo.zabbix.com/RPM-GPG-KEY-ZABBIX
rpm -Uv http://repo.zabbix.com/zabbix/2.4/rhel/7/x86_64/zabbix-release-2.4-1.el7.noarch.rpm
yum install zabbix-agent -y
On Ubuntu/Debian clients, run:
sudo apt-get install zabbix-agent
Configure Clients
Next edit file /etc/zabbix/zabbix_agentd.conf,
sudo vi /etc/zabbix/zabbix_agentd.conf
Add the server ip address and client hostname.
[...]
## Specify Zabbix's server IP address ##
Server=192.168.1.150
[...]
##Specify Zabbix's server IP address ##
ServerActive=192.168.1.150
## Specify client system hostname ##
Hostname=server2.unixmen.local
[...]
Where,
- 192.168.1.150 – My Zabbix server IP address
- server2 – My Zabbix client’s hostname
Now restart zabbix-agent service with command:
In Ubuntu/Debian:
sudo service zabbix-agent start
In CentOS 7:
systemctl start zabbix-agent
systemctl enable zabbix-agent
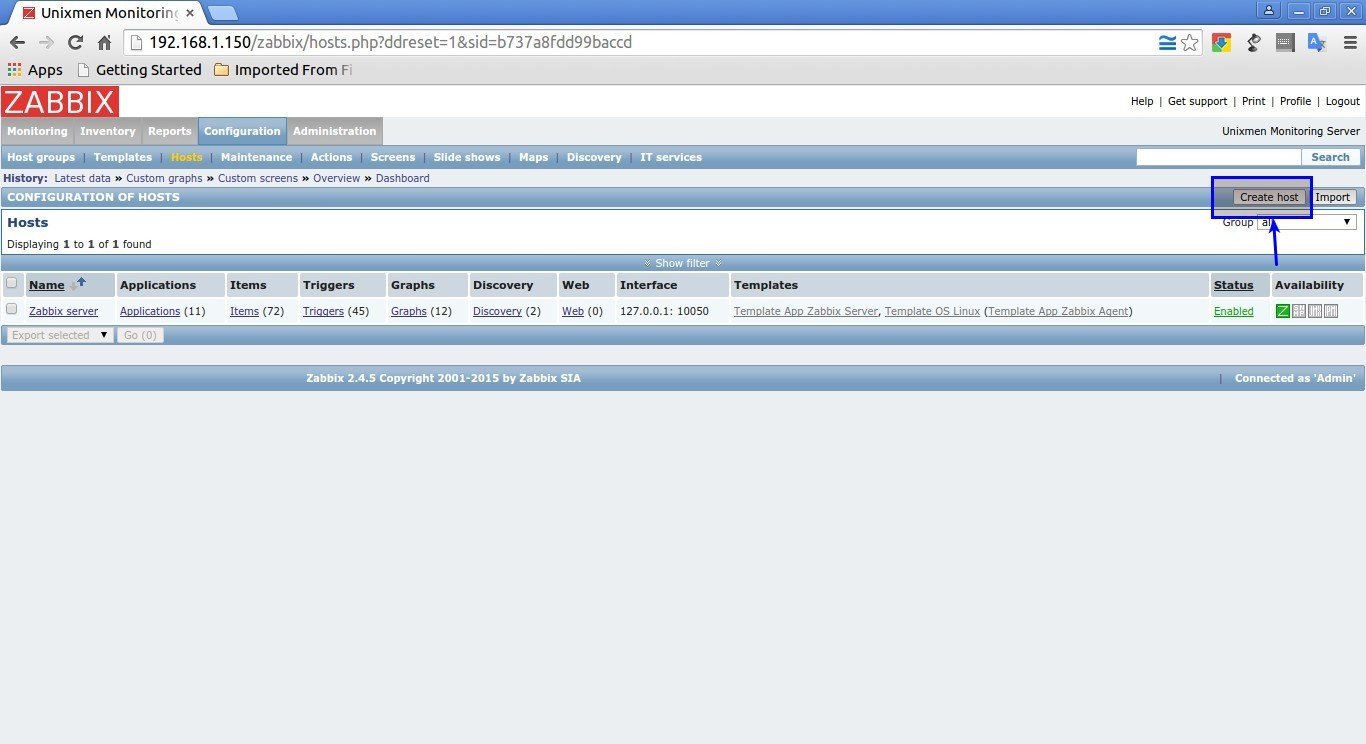
Add Monitoring hosts
Go to your zabbix server dashboard.
To add a monitoring target, navigate to Configuration -> Hosts. Click on Create Host on the right side.
Enter Hostname, select Groups and IP address in the Host section as shown below.
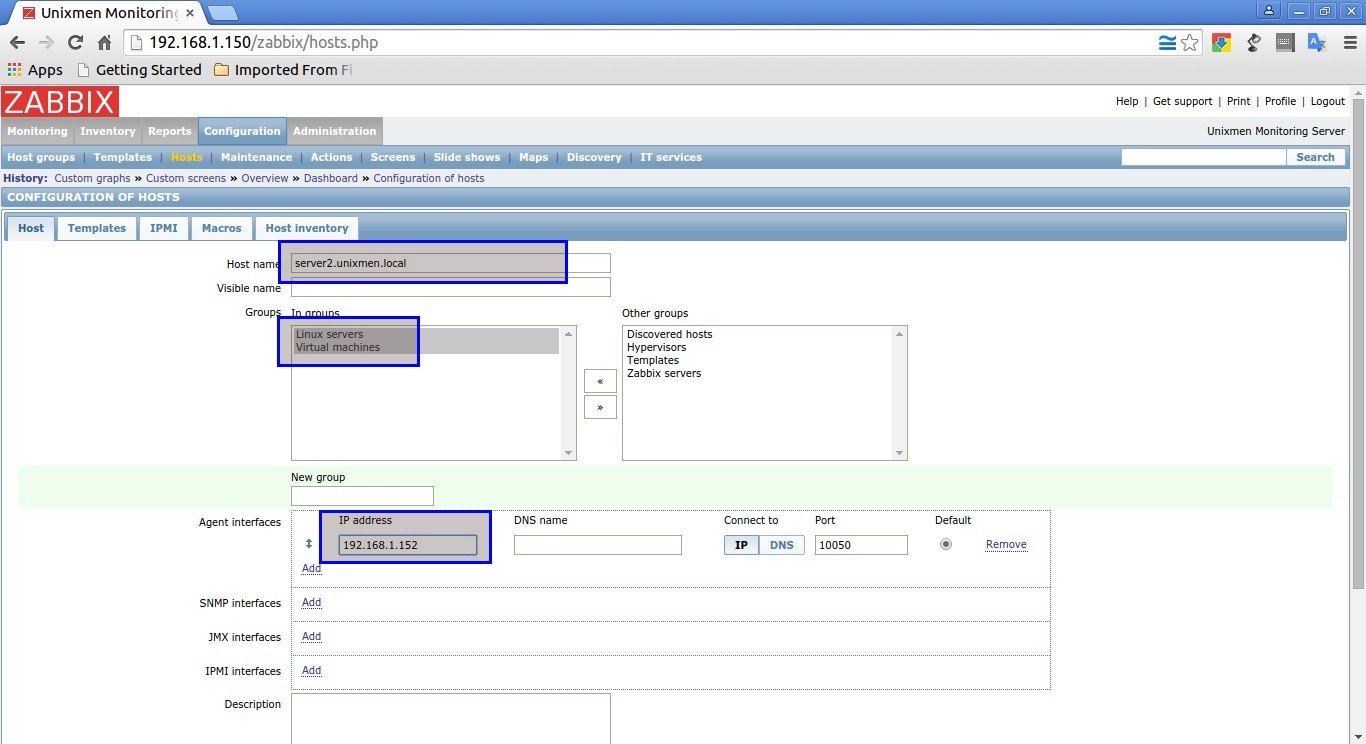
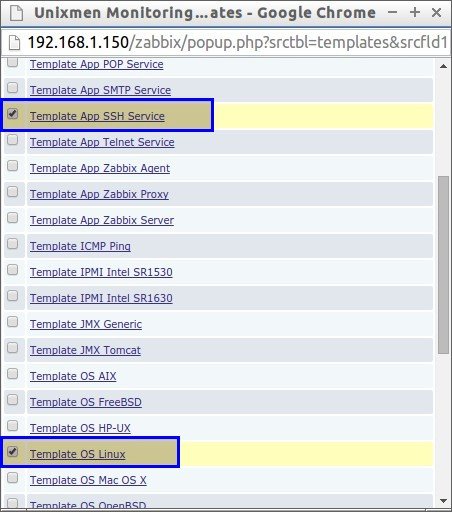
Next, In the Templates section select your Template.
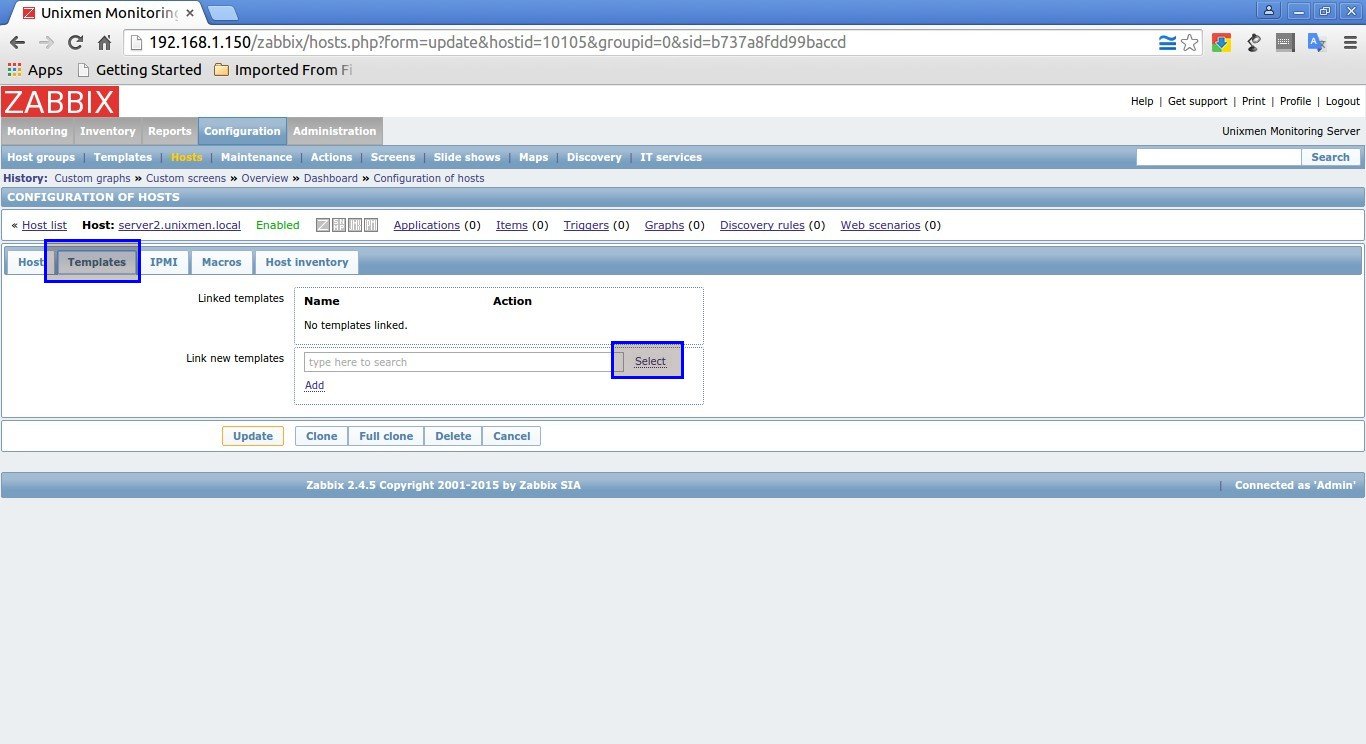
In my case, I selected Linux Template and SSH template. After selecting your Template choice click Select button in the bottom.
In the next window, click Add and click Update buttons.
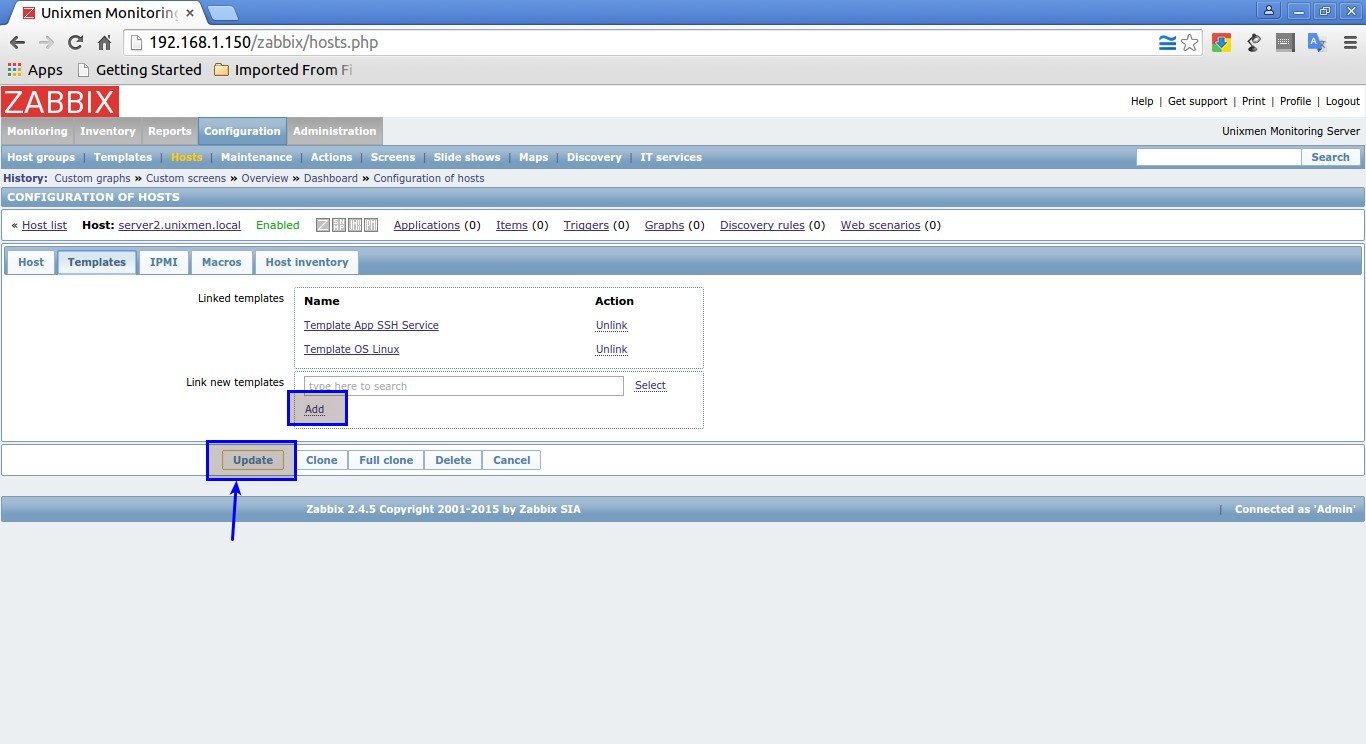
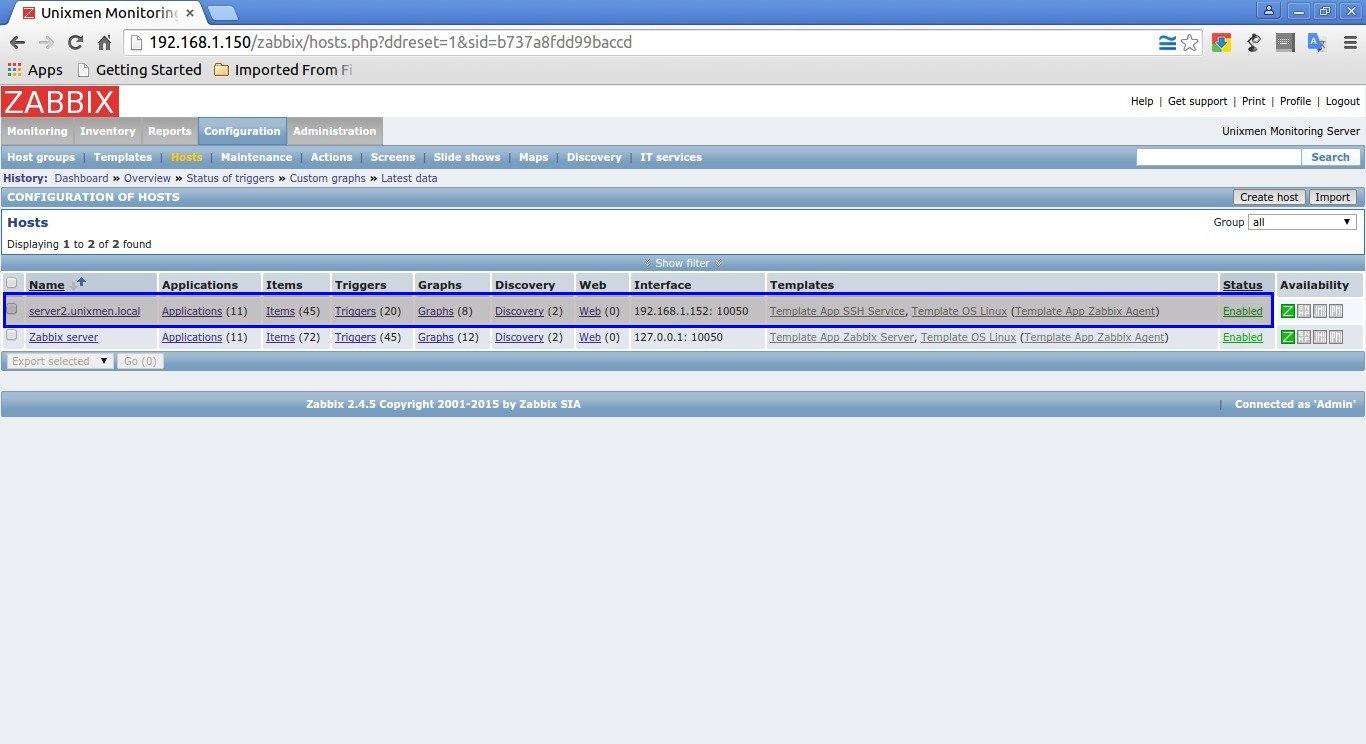
Now, you will see that the new host has been added to the Monitoring list.
That’s it.
If there is any problem in the Client system, you can view them in the main Dashboard of your Zabbix’s server.
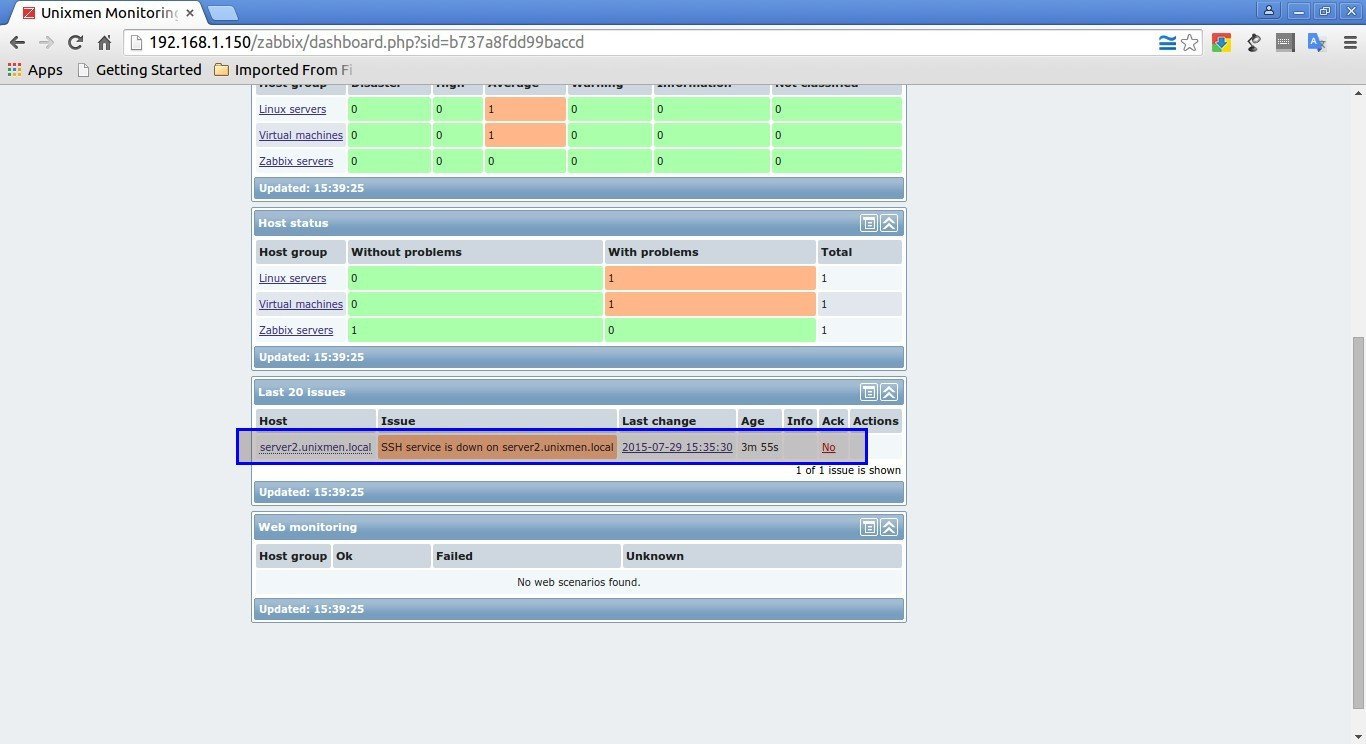
Go to Monitoring -> Latest data to check the details of client.
![Unixmen Monitoring Server: Latest data [refreshed every 30 sec.] - Google Chrome_002](http://unixmen.com/wp-content/uploads/2015/07/Unixmen-Monitoring-Server-Latest-data-refreshed-every-30-sec.-Google-Chrome_0021.jpg)
You can view the list of all warnings and information in Monitoring -> Triggers location.
![Unixmen Monitoring Server: Status of triggers [refreshed every 30 sec.] - Google Chrome_003](http://unixmen.com/wp-content/uploads/2015/07/Unixmen-Monitoring-Server-Status-of-triggers-refreshed-every-30-sec.-Google-Chrome_003.jpg)
Conclusion
In this tutorial, we have covered only installation part and basic configuration of Zabbix. To learn more about Zabbix, explore all the options in the Zabbix’s dashboard one by one and set up a best monitoring solution that suits your requirement.
For more details about configuration and usage, refer Zabbix Official manual.
Good luck.
If you want to deploy Zabbix in CentOS 6.x systems, refer the following link.
Reference Links:


