
Darkstat is a simple, lightweight, web based network statistics gatherer. It is a packet sniffer that runs as a background process, collects all sorts of network statistics about network usage, and serves them over HTTP.
Darkstat can run on any modern Unix/Linux like systems that has libpcap such as,
– AIX
– FreeBSD, NetBSD, OpenBSD
– Linux (Archlinux, Debian, Fedora, Gentoo, OpenSUSE, Ubuntu)
– Mac OS X
– Solaris
Features
– Traffic graphs, reports per host, shows ports for each host.
– Embedded web-server with deflate compression.
– Asynchronous reverse DNS resolution using a child process.
– Small. Portable. Single-threaded. Efficient.
– Supports IPv6.
Install Darkstat
Darkstat is available in the default repositories of Debian/Ubuntu systems, so you can install it using the following command:
$ sudo apt-get install darkstat
On Fedora:
It is available in Fedora official repositories, so install it using the command:
$ sudo yum install darkstat
Configure Darkstat
Once you have installed Darkstat, you must edit and set the following changes in /etc/darkstat/init.cfg file.
Edit file /etc/darkstat/init.cfg,
$ sudo nano /etc/darkstat/init.cfg
Make the changes as shown below.
# Turn this to yes when you have configured the options below.
START_DARKSTAT=yes   ## Change no to yes ##

# Don't forget to read the man page.

# You must set this option, else darkstat may not listen to
# the interface you want
INTERFACE="-i eth0"   ## Interface you want darkstat to listen ##
INTERFACE="-i eth1"   ## Interface you want darkstat to listen ##

DIR="/var/lib/darkstat"   ## Uncomment ##
PORT="-p 666"     ## uncomment##
BINDIP="-b 192.168.1.250"   ## Uncomment and set ip address of your eth0 or eth1 ##
LOCAL="-l 192.168.1.0/255.255.255.0"   ## Uncomment and set ip range to listen ##

[...]
Save and close the file.
Now start darkstat daemon using the command:
$ sudo /etc/init.d/darkstat start
Darkstat Usage
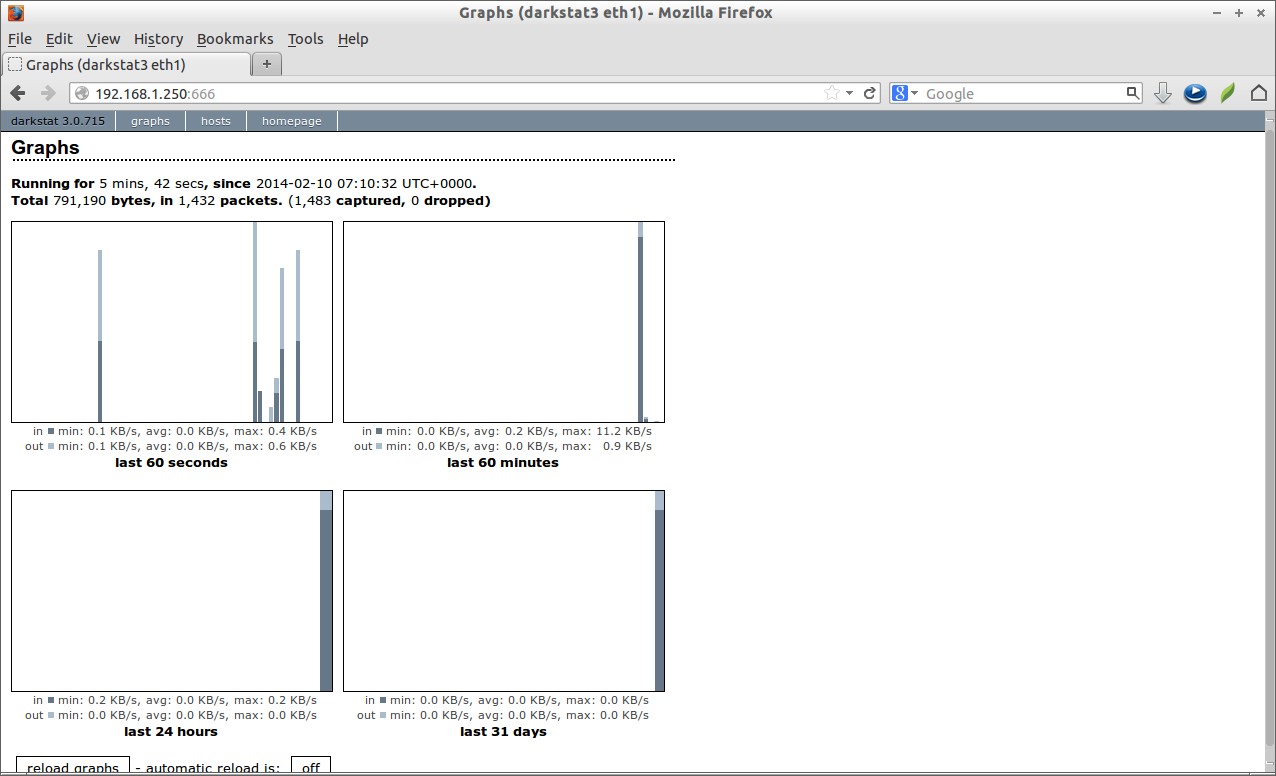
Open up your browser and point to http://ip-address:666/. Now you should see the graphs as shown below.
Graphs view:
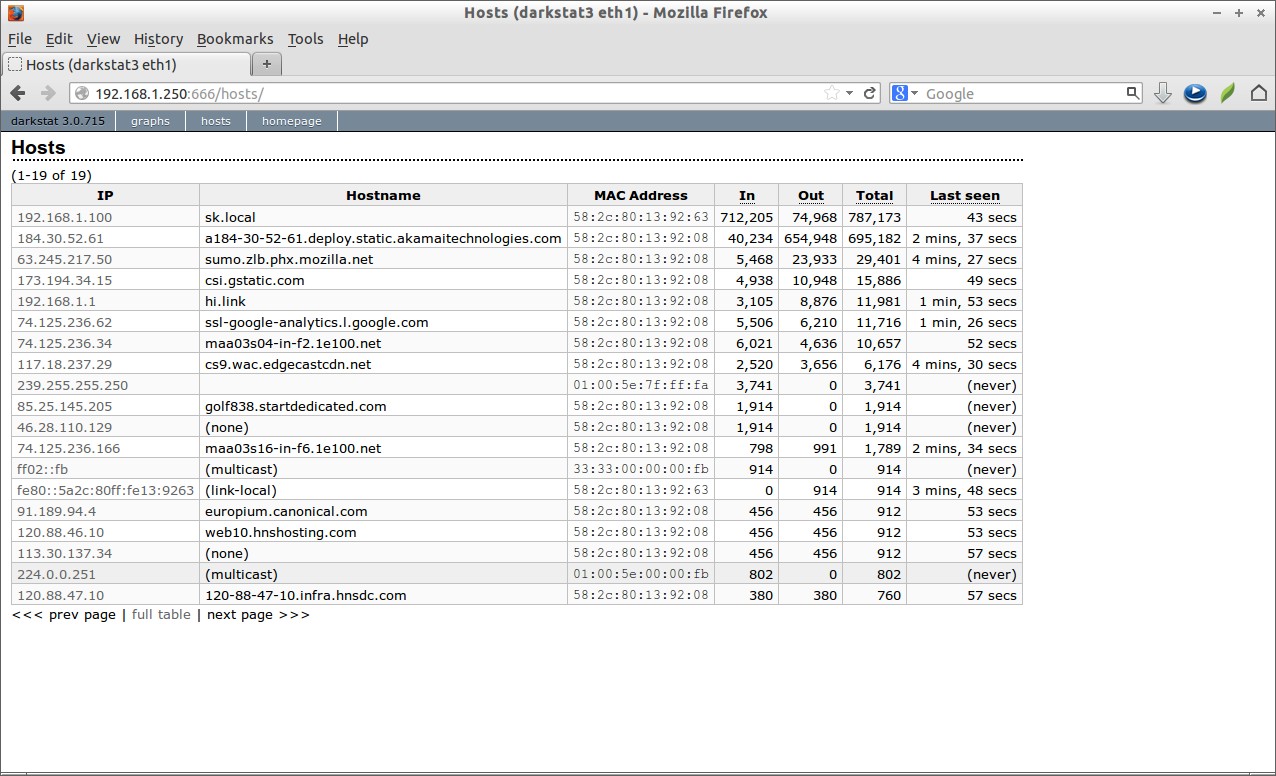
Hosts view:
Click on the hosts link on the top to see the list of hosts which are monitored by darkstat.
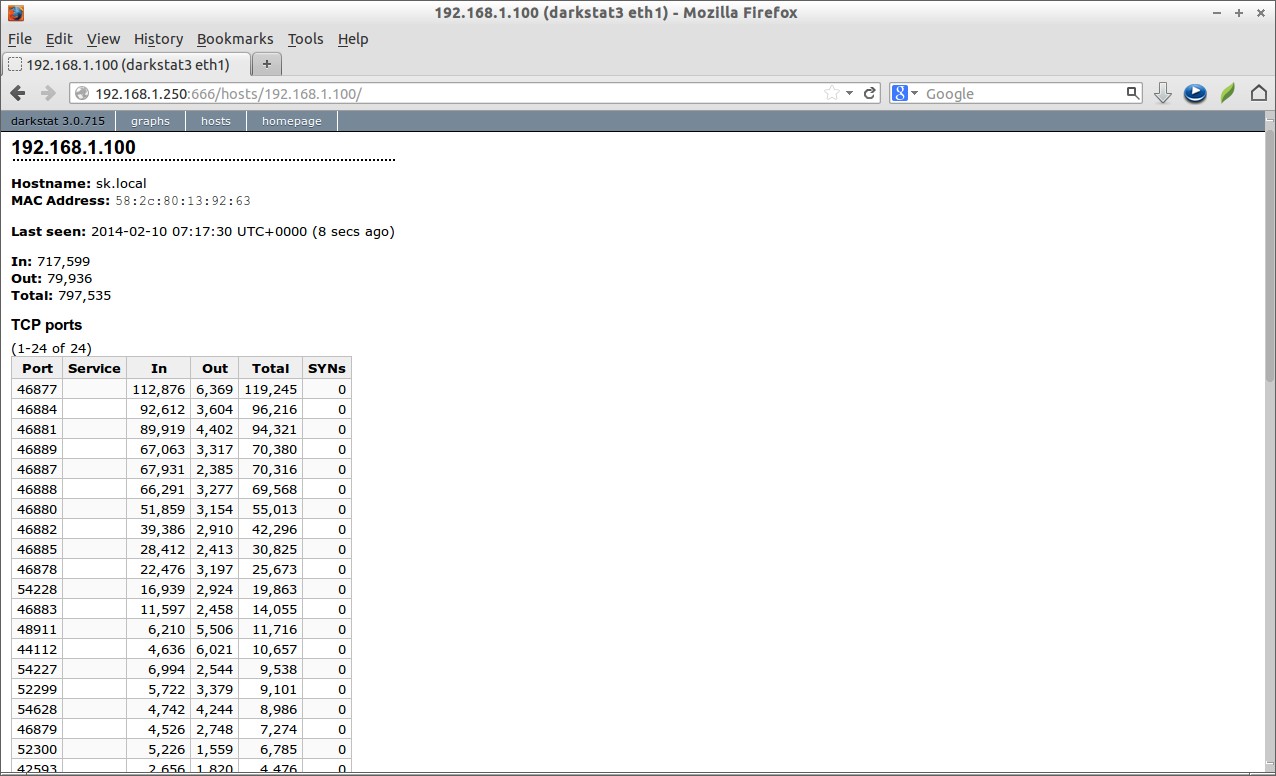
If you want to view the traffic of a particular host, click on the IP address of the host. You should then see the traffic caused by the corresponding IP address.
Conclusion
Darkstat is yet another simple network analyzer tool like ntop and vnstat that can be used to monitor the input/output traffic caused by the systems in the network. It works well as its advertised and has a constant development cycle. Hope it will useful for you.
Reference Links:


