
Introduction
Cacti is an opensource RRDTool (Round Robin Database Tool) that enables you to input data and information feeds to the platform and it will automatically generate accurate graphs and diagrams based on the feeds. Generally, it can graph network bandwidthes with SNMP. Besides, a lot of different graphs can be done with snmp, shell or perl scripts. In the screenshots part, you can view which kind of graphs can be made with Cacti.
Cacti’s strength lies in the fact that it can be installed and used incredibly easily. You don’t need to spend long hours to configure it. Even a beginner can use it very quickly. You can very easily add plugins to the Cacti enabling the possibility to integrate other free tools like ntop or php weathermap. We can say that it is the best RRDtool frontend.
Before to start, if you still didn’t install cacti, check the following articles.
- http://unixmen.com/monitor-vmware-esxi-host-using-cacti/
- http://unixmen.com/install-cacti-ubuntu-14-04/
- http://unixmen.com/install-cacti-network-monitoring-tool-on-centos-6-4-rhel-6-4-scientific-linux-6-4/
Cacti’s graph features
Cacti is a complete network graphing solution designed to harness the power of RRDTool’s data storage and graphing functionality. It provides a fast poller, advanced graph templating, multiple data acquisition methods, and user management features out of the box. All of this is wrapped in an intuitive, easy to use interface that makes sense for LAN-sized installations up to complex networks with hundreds of devices. From its features we choose to describe its graphs:
- Unlimited number of graph items can be defined for each graph optionally utilizing CDEFs or data sources from within cacti.
- Automatic grouping of GPRINT graph items to AREA, STACK, etc to allow for quick re-sequencing of graph items.
- Auto-Padding support to make sure graph legend text lines up.
- Graph data can be manipulated using the CDEF math functions built into RRDTool. These CDEF functions can be defined in cacti and can be used globally on each graph.
- Support for all of RRDTool’s graph item types including AREA, STACK, LINE[1-3], GPRINT, COMMENT, VRULE, and HRULE.
In this article, we will work with the following example. We want to graph the bandwidth of an interface and to get just one graph to retain the historic data for over a year. Noting that the services were running on eth0 for one year and now were moved to eth1 due to some problem.
Step 1: Find the RRD of the graph
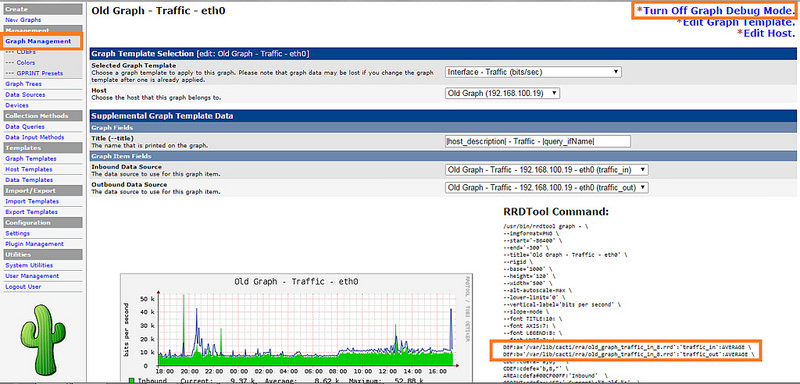
We will start by identifying the RRD file associated to the graph. We can open the graph in debug mode to check the file. So go to Cact’is menu: Then to console > graph management > select graph > turn on graph debug mode. We have the two following graphs that we want to combine.
First graph:
Second graph:
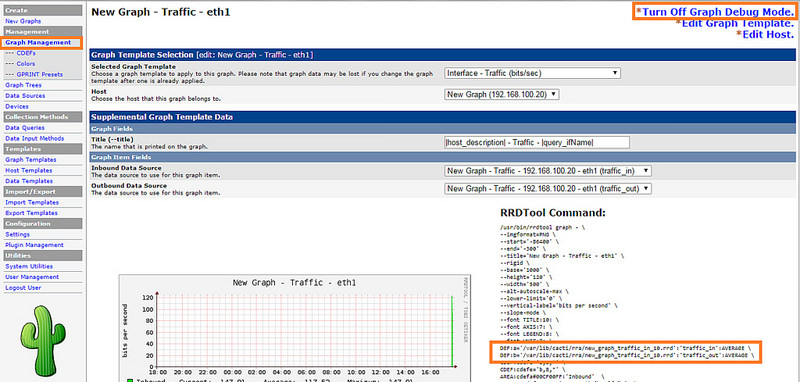
We are working with Debian system for this example, you can find the RRD fils for the two graphs by From the example output (which is based on a Debian system), we can identify the RRD files for two graphs using the following path:
- /var/lib/cacti/rra/Your_Graph
If you are working with Red Hat based systems, you will find them under the path:
- /var/www/cacti/rra.
Step 2: Prepare the script
Now we will combine the two RRD files using the RRD splice script. To do you have to download PHP script, install it on /var/lib/cacti/rra/rrdsplice.php (for Debian/Ubuntu) or /var/www/cacti/rra/rrdsplice.php (for CentOS/RHEL). And be sure that you have your file with Apache user. Then use the following command if you are working:
- With Debian or Ubuntu:
# chown www-data:www-data rrdsplice.php
Then you have to update the rrdsplice.php file. So open it and find the following line:
chown($finrrd, "apache");
replace it with the following one:
chown($finrrd, "www-data");
- With CentOS or RHEL:
# chown apache:apache rrdsplice.php
Step 3: combine two graphs
Now you have to find the syntax of the script. You need to use the following command:
# cd /path/to/rrdsplice.php
# php rrdsplice.php
You will get your usage which will look like the following:
USAGE: rrdsplice.php --oldrrd=file --newrrd=file --finrrd=file
And now you can combine the two RRD files. So to do start by supplying the names of the old RRD file and the new RRD file. And copy the combined result back to the new RRD file. Like it was written in the following command by replacing the red words by your RRD files names:
# php rrdsplice.php --oldrrd=your_old_graph --newrrd=your_new_graph --finrrd=your_new_graph
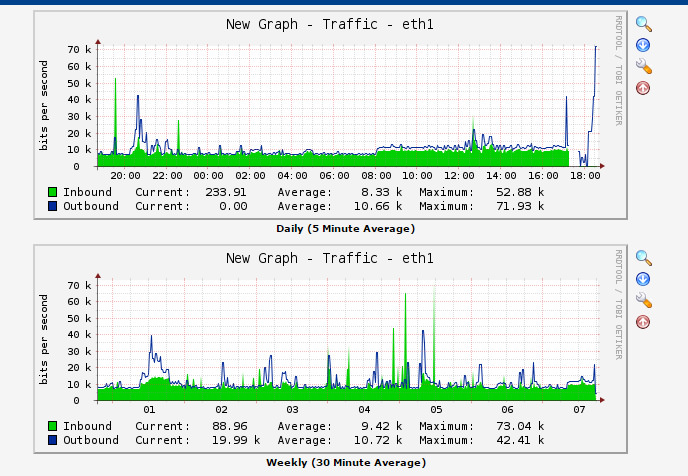
Now all the new data will be written by Cacti in the new RRD file. You can check that the weekly, monthly and yearly records have also been added from the old graph. This is our found result:
Conclusion
In this article we showed you how you can combine two Cacti graphs. You will find that it is usefull and easy to make if there is a problem with your service and a modification of the interface.


