
Monitoring the performance of a server is one of the core part of a system administrator’s job. You can do everything on a server but it’s not worth it if you are unable to trace where the system is lagging behind and what are the thresholds. The best thing about Linux is that there are hundreds of commands which can let you know what type of consumption is being done at the machine end. Followings are the commands which we will discuss in this article in order to let you know how you can buy xanax prescription monitor your system’s health and make improvements accordingly.
1- Top
2- HTOP
3- Free
4- Nethogs
5- MyTOP
6- IOStat
7- SAR
8- LSOF
9- VMSTAT
10- ATOP
TOP
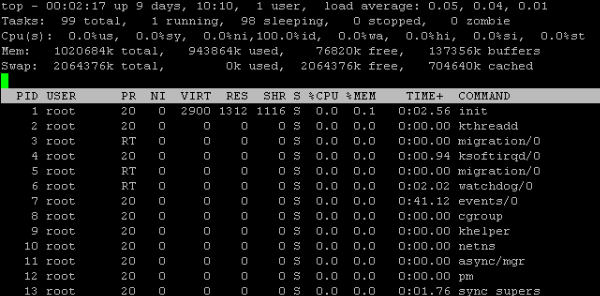
Top is a basic command which majority of system admins use as part of their daily job. You don’t need to install TOP as it’s already part of every Linux distribution. Following screenshot shows the result of top command. As you can see in the following screenshot running tasks , their CPU, memory and swap usage. You can do whole lot of things to get the output of your liking and need. It has a large number of options/switches which you can use to make your life easy.
Htop
Htop is another tool just like “top” to monitor your systems processes. It comes with an interactive overview and you can kill processes by just going on them and pressing the desired button. It’s better than top because it has different mediums of showing memory and swap. You can install htop by the following command.
[cc] yum install htop [/cc]
Free
Free also comes pre-installed with Linux distributions, to check the memory usage. It shows you buffers and cached memory as well. There are several formats like KB, MB and GB. You just have to use ‘m’ and ‘g’ parameter with the command. Following the screenshot of memory check in MB’s.
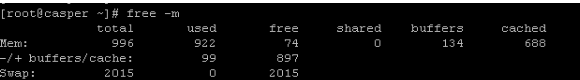
The above screenshot shows a total of 996MB with 74 MB left free and 688MB cached.
NetHogs
You want to know where on internet your server is opening connections and using the bandwidth then nethogs is an interactive tool for the task. It shows all the ports which are opened to different IP addresses over the internt and monitor consumption of bandwidth on each opened connection. You can install nethogs by the following command.
[cc] yum install nethogs [/cc]
Mytop
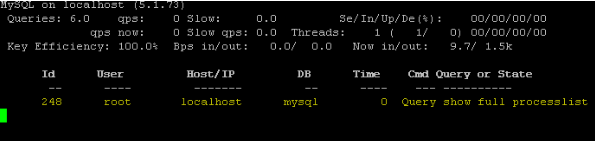
Mytop tool allows you to monitor your systems mysql performance. It keeps refreshing itself like watch command. It opens a connection to mysql and remains in monitor state and execute the “SHOW FULL PROCESSLIST” query from time to time. Following command is used to monitor mysql database.
[cc] mytop –u root –p XXX –d mysql [/cc]
Following is the screenshot of mytop command which we executed earlier.
Iostat
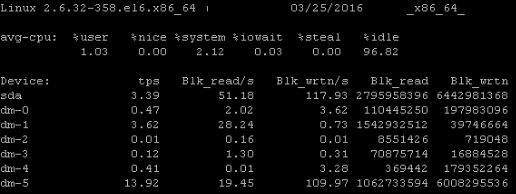
Iostat command reports you the CPU and disk I/O stats. Reads and writes are shown as block read and block writes. You can get the idle percentage of your CPU to check how much time it has not done any heavy task. Following is the output of iostat command. As you can see in the following screenshot that system is 96 percent idle while sda represents you hard disk.
Sar
Sar command is somehow similar to the “Iostat” command but one thing that’s different is that it tells you I/O writes for the last half hour with other parameters like system usage, i/o wait and idle time percentage. You will need to run following command to install sar command on RHEL and its derivatives.
[cc] yum -y install sysstat [/cc]
Lsof
As you know that in Linux every process opens a file on the backend so if you want to check that a process is spawned or not, you have to check the file opened for that process in the respective partition/directory. LSOF command lets you know the files opened. For exmaple, which files are currently opened from /var partition, you will use it as:
[cc] lsof /var [/cc]
Vmstat
As the name suggests, this command is used to monitor virtual memory statistics. The best thing about this command is that it can enter monitor state on the basis of interval you have specified in the command. It lets you know the load, paging and interrupts a server is handling in that time. Following is command to monitor virtual memory after every 5 seconds.
[cc] vmstat 5 [/cc]
Atop
Atop is a very critical command for monitoring of your server. It combines features of both; top and htop, with additional feature of daily level logging. It highlights the processes which have reached a threshold limit of load.
Conclusion
All of the above mentioned commands are pretty useful for analyzing the performance of your Linux system. A good administrator should have strong knowledge of using these command quickly and getting the output of his/her needs.


