
smem is an open source application that can be used to find out which processes or users are using the physical memory. It gives numerous reports on memory usage on Linux systems. Unlike existing tools, smem can report proportional set size (PSS), which is a more meaningful representation of the amount of memory used by libraries and applications in a virtual memory system.
Because large portions of physical memory are typically shared among multiple applications, the standard measure of memory usage known as resident set size (RSS) will significantly overestimate memory usage. PSS instead measures each application’s “fair share” of each shared area to give a realistic measure.
Features
– system overview listing
– listings by process, mapping, user
– filtering by process, mapping, or user
– configurable columns from multiple data sources
– configurable output units and percentages
– configurable headers and totals
– reading live data from /proc
– reading data snapshots from directory mirrors or compressed tarballs
– lightweight capture tool for embedded systems
– built-in chart generation
Install Smem On Debian/Ubuntu/Linux Mint
Smem can be installed in a Linux systems that meets the following requirements.
– Kernel version greater than 2.6.27.
– Python 2.4 or higher.
– the matplotlib library for chart generation (optional, auto-detected).
You can install Smem on Debian and its derivatives using the following command:
$ sudo apt-get install smem
The above command will install Smem along all required dependencies.
Smem Usage
Here are some Smem usage examples.
Syntax
smem [options]
Smem reports physical memory usage, taking shared memory pages into account. Unshared memory is reported as the USS (Unique Set Size). Shared memory is divided evenly among the processes sharing that memory. The unshared memory (USS) plus a process’s proportion of shared memory is reported as the PSS (Proportional Set Size). The USS and PSS only include physical memory usage. They do not include memory that has been swapped out to disk. Memory can be reported by process, by user, by mapping, or systemwide. Both text mode and graphical output are available.
Let us see what it will give when we run the following smem command without any options in Terminal:
$ smem
Sample output:

As you see in the above screenshot, the Smem command is displaying the complete Physical memory usage used by each process and by user respectively.
Let us see more examples of smem usage with some options.
To view the system wide memory usage, use the flag -w.
$ smem -w
Sample output:
Area                           Used      Cache   Noncache
firmware/hardware                 0          0          0
kernel image                      0          0          0
kernel dynamic memory        406376    -308904     715280
userspace memory            1541180     655556     885624
free memory                   95076      95076          0
To view the memory usage by each user, use parameter -u.
$ smem -u
Sample output:
User     Count     Swap      USS      PSS      RSS
sk          46   132772   812852   820534   875004
To view the memory usage by mapping, enter the following command:
$ smem -m
Sample output:
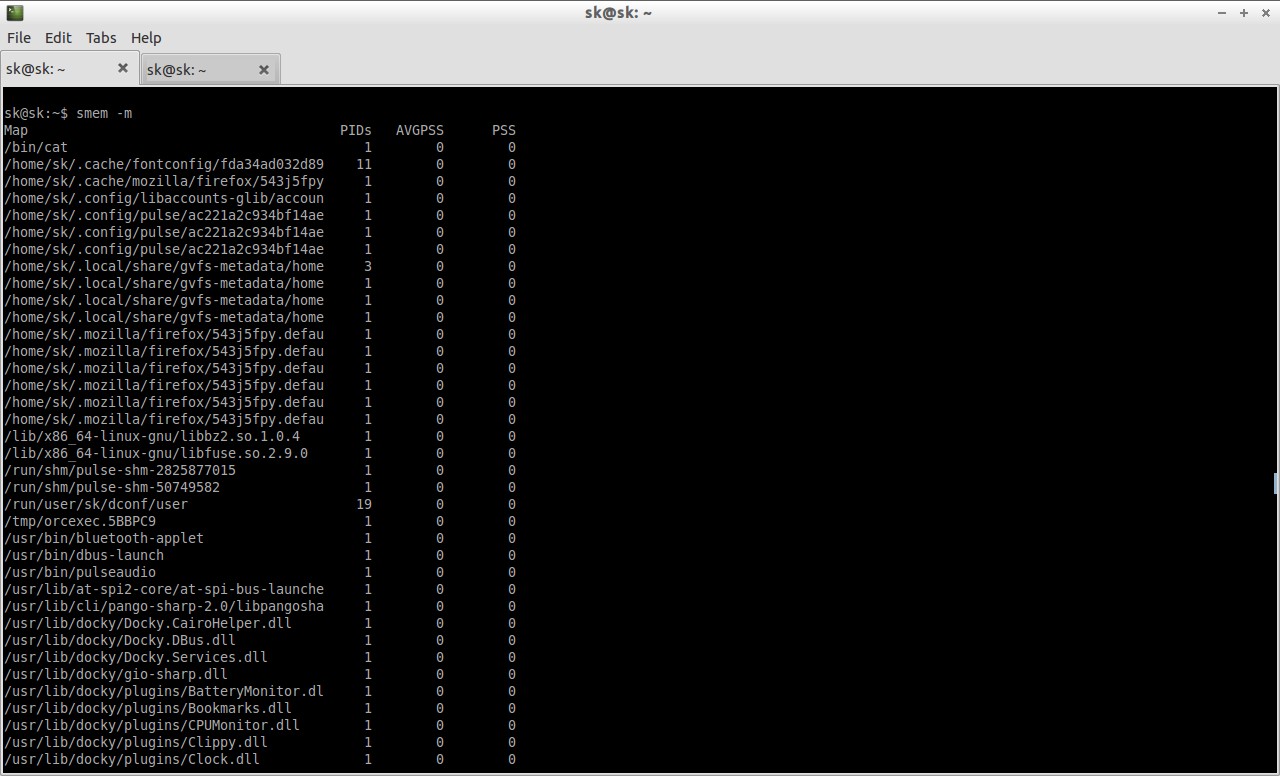
To know more about Smem use man pages.
$ man smem
Or simply use the -h flag with smem command:
$ smem -h
Smem Graphs
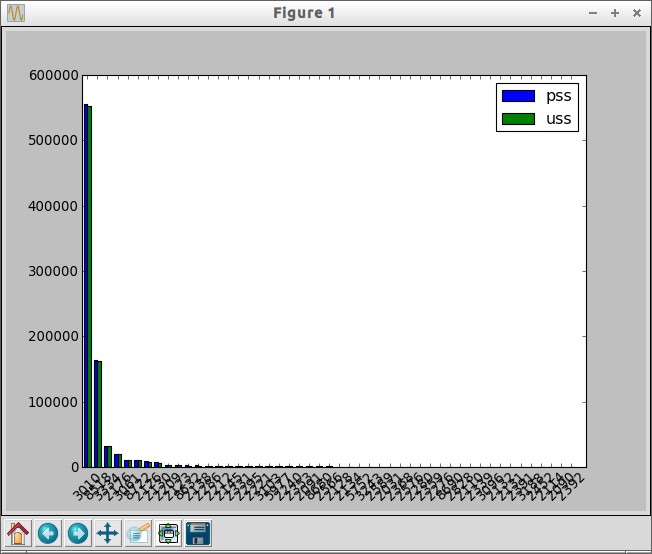
It’s also possible to display the the bar and pie graphs of memory usage. To view the bar graph, use the following command:
$ smem --bar pid -c "pss uss"
Sample output:
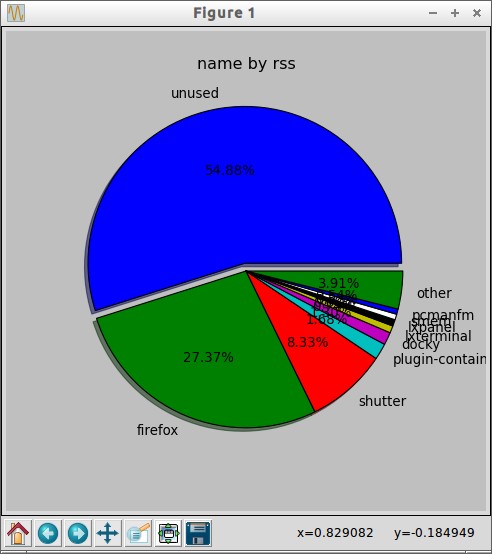
To view the pie graph, use the following command:
$ smem --pie name -s rss
Sample output:
Conclusion
Smem seems to be a promising tool that can be used to inspect the usage of our physical memory. Also it’s very easy to use and it has lot of options to get more useful information about the RAM usage.
Reference:


