
Introduction
Achieving good performance from a computer or network is an important part of system administration.The monitoring and maintenance of the system is the most important task listed in the checklists for daily tasks of a system and network administrator. There are many commands line utilities created for this purpose.
This article describes how you can monitor services and attributes of Linux/UNIX servers using command line, such as:
- CPU load
- Bandwidth
- Memory usage
- Disk usage
- Logged in users
- Running processes
- etc.
Let’s start.
Displaying Disk Space Statistics
df
Use the df command to show the amount of free disk space on each mounted disk. The percentage of disk space actually reported by the df command is used space divided by usable space.
When the df command is used without operands or options, it reports on all mounted file systems, as shown in the following example:
$ df
Filesystem 1K-blocks Used Available Use% Mounted on
/dev/mapper/ubuntutest--vg-root 19729068 1302972 17400868 7% /
none 4 0 4 0% /sys/fs/cgroup
udev 231664 4 231660 1% /dev
tmpfs 48652 608 48044 2% /run
none 5120 0 5120 0% /run/lock
none 243240 0 243240 0% /run/shm
none 102400 0 102400 0% /run/user
/dev/sda1 240972 39056 189475 18% /boot
Use the df -k command to display disk space information in Kbytes like the following example:
$ df -k
Filesystem 1K-blocks Used Available Use% Mounted on
/dev/mapper/ubuntutest--vg-root 19729068 1302972 17400868 7% /
none 4 0 4 0% /sys/fs/cgroup
udev 231664 4 231660 1% /dev
tmpfs 48652 608 48044 2% /run
none 5120 0 5120 0% /run/lock
none 243240 0 243240 0% /run/shm
none 102400 0 102400 0% /run/user
/dev/sda1 240972 39056 189475 18% /boot
Use the df -h command to specify to output in a human-readable format.
$ df -h
Filesystem Size Used Avail Use% Mounted on
/dev/mapper/ubuntutest--vg-root 19G 1.3G 17G 7% /
none 4.0K 0 4.0K 0% /sys/fs/cgroup
udev 227M 4.0K 227M 1% /dev
tmpfs 48M 608K 47M 2% /run
none 5.0M 0 5.0M 0% /run/lock
none 238M 0 238M 0% /run/shm
none 100M 0 100M 0% /run/user
/dev/sda1 236M 39M 186M 18% /boot
du
To Display the size of one or more directories, subdirectories, and files use the du command.
$ du [-as] [directory ...]
du
Displays the size of each directory that you specify, including each subdirectory beneath it.
-a
Displays the size of each file and subdirectory, and the total number of blocks that are contained in the specified directory.
-s
Displays the total number of blocks that are contained in the specified directory.
-h
Displays the size of each directory in 1024–byte blocks.
-H
Displays the size of each directory in 1000–byte blocks.
[directory …]
Identifies one or more directories that you want to check. Separate multiple directories in the command-line syntax with spaces.
The following example shows directory sizes in 1024–byte blocks.
$ du -h /usr/share/audio
 796K   /usr/share/audio/samples/au
 797K   /usr/share/audio/samples
 798K   /usr/share/audio
Displaying Virtual Memory Statistics
vmstat
You can use the vmstat command to report virtual memory statistics and information about system events such as CPU load, paging, number of context switches, device interrupts, and system calls. The vmstat command can also display statistics on swapping, cache flushing, and interrupts.
You can collect virtual memory statistics by using the vmstat command with a time interval in seconds.
$ vmstat n
The following example shows the vmstat display of statistics that were gathered at 5 second intervals:
$ vmstat 5
procs -----------memory---------- ---swap-- -----io---- -system-- ------cpu-----
 r b swpd free buff cache si so bi bo in cs us sy id wa st
 0 0 332 43500 7584 228056 0 0 16 25 32 57 0 0 99 0 0
 0 0 332 43484 7584 228088 0 0 0 1 70 92 0 0 100 0 0
 0 0 332 43420 7592 228088 0 0 0 3 97 104 0 0 100 0 0
 0 0 332 43484 7596 228084 0 0 0 9 93 105 0 0 100 0 0
 0 0 332 43516 7596 228088 0 0 0 0 93 104 0 0 100 0 0
 0 0 332 43516 7600 228088 0 0 0 1 83 126 0 0 100 0 0
 0 0 332 43672 7600 228088 0 0 0 0 62 103 0 0 100 0 0
 0 0 332 43672 7600 228088 0 0 0 0 71 115 0 0 100 0 0
 0 0 332 43640 7600 228088 0 0 0 0 71 110 0 0 100 0 0
 0 0 332 43640 7600 228088 0 0 0 0 51 86 0 0 100 0 0
 0 0 332 43608 7600 228088 0 0 0 0 75 121 0 0 100 0 0
 0 0 332 43640 7600 228088 0 0 0 0 79 119 0 0 100 0 0
 0 0 332 43640 7600 228088 0 0 0 0 66 109 0 0 100 0 0
 0 0 332 43640 7600 228088 0 0 0 0 76 119 0 0 100 0 0
 0 0 332 43640 7600 228088 0 0 0 0 74 118 0 0 100 0 0
Run the vmstat -s command to show how many system events have taken place since the last time the system was booted.
$ vmstat -s
 486484 K total memory
 442828 K used memory
 183832 K active memory
 148632 K inactive memory
 43656 K free memory
 7600 K buffer memory
 228088 K swap cache
 520188 K total swap
 332 K used swap
 519856 K free swap
 2987 non-nice user cpu ticks
 152 nice user cpu ticks
 2620 system cpu ticks
 1191969 idle cpu ticks
 3232 IO-wait cpu ticks
 6 IRQ cpu ticks
 789 softirq cpu ticks
 0 stolen cpu ticks
 190420 pages paged in
 295590 pages paged out
 194 pages swapped in
 310 pages swapped out
 386194 interrupts
 682710 CPU context switches
 1422373173 boot time
 2507 forks
Run the vmstat -w command to show wide output.
$ vmstat -w
procs ---------------memory-------------- ---swap-- -----io---- -system-- ------cpu-----
 r b swpd free buff cache si so bi bo in cs us sy id wa st
 1 0 332 43712 7600 228088 0 0 15 24 32 57 0 0 99 0 0
free
The free command provides information about unused and used memory and swap space on any computer running Linux or another Unix-like operating system.
$ free
 total used free shared buffers cached
Mem: 486484 443240 43244 5884 7612 228096
-/+ buffers/cache: 207532 278952
Swap: 520188 268 519920
You can pass the “-m” option to display the output in megabytes:
$ free -m
 total used free shared buffers cached
Mem: 475 433 41 5 7 222
-/+ buffers/cache: 202 272
Swap: 507 0 507
Displaying Open Files Statistics
Lsof
Lsof command used in many Linux/Unix like system that is used to display list of all the open files and the processes. The open files included are disk files, network sockets, pipes, devices and processes.
$ lsof
COMMAND PID TID USER FD TYPE DEVICE SIZE/OFF NODE NAME
init 1 root cwd DIR 252,0 4096 2 /
init 1 root rtd DIR 252,0 4096 2 /
init 1 root txt REG 252,0 302968 1048817 /sbin/upstart
init 1 root mem REG 252,0 47712 655624 /lib/x86_64-linux-gnu/libnss_files-2.19.so
init 1 root mem REG 252,0 47760 655628 /lib/x86_64-linux-gnu/libnss_nis-2.19.so
init 1 root mem REG 252,0 97296 655618 /lib/x86_64-linux-gnu/libnsl-2.19.so
init 1 root mem REG 252,0 39824 655620 /lib/x86_64-linux-gnu/libnss_compat-2.19.so
init 1 root mem REG 252,0 145224 655655 /lib/x86_64-linux-gnu/libpthread-2.19.so
init 1 root mem REG 252,0 1844160 655565 /lib/x86_64-linux-gnu/libc-2.19.so
init 1 root mem REG 252,0 32032 655661 /lib/x86_64-linux-gnu/librt-2.19.so
init 1 root mem REG 252,0 293960 655579 /lib/x86_64-linux-gnu/libdbus-1.so.3.8.7
init 1 root mem REG 252,0 38920 655615 /lib/x86_64-linux-gnu/libnih-dbus.so.1.0.0
init 1 root mem REG 252,0 96280 655617 /lib/x86_64-linux-gnu/libnih.so.1.0.0
init 1 root mem REG 252,0 133056 655570 /lib/x86_64-linux-gnu/libcgmanager.so.0.0.0
init 1 root mem REG 252,0 43464 655597 /lib/x86_64-linux-gnu/libjson-c.so.2.0.0
init 1 root mem REG 252,0 150552 655545 /lib/x86_64-linux-gnu/ld-2.19.so
init 1 root 0u CHR 1,3 0t0 8667 /dev/null
init 1 root 1u CHR 1,3 0t0 8667 /dev/null
init 1 root 2u CHR 1,3 0t0 8667 /dev/null
init 1 root 3r FIFO 0,8 0t0 255 pipe
init 1 root 4w FIFO 0,8 0t0 255 pipe
init 1 root 5r 0000 0,9 0 8620 anon_inode
init 1 root 6r 0000 0,9 0 8620 anon_inode
init 1 root 7u unix 0xffff88001ef2de80 0t0 256 @/com/ubuntu/upstart
init 1 root 8u unix 0xffff88001ef28a80 0t0 552 @/com/ubuntu/upstart
init 1 root 9u unix 0xffff88001ef2fa80 0t0 768 socket
init 1 root 10u unix 0xffff88001ef28000 0t0 802 @/com/ubuntu/upstart
init 1 root 11w REG 252,0 5281 404967 /var/log/upstart/thermald.log
init 1 root 12w REG 252,0 778 405097 /var/log/upstart/mysql.log
init 1 root 14u CHR 5,2 0t0 9859 /dev/ptmx
init 1 root 15u unix 0xffff880016f49180 0t0 501 @/com/ubuntu/upstart
init 1 root 28u CHR 5,2 0t0 9859 /dev/ptmx
kthreadd 2 root cwd DIR 252,0 4096 2 /
The below command will display the list of all opened files of user anism.
$ lsof -u anism
COMMAND PID USER FD TYPE DEVICE SIZE/OFF NODE NAME
bash 1861 anism cwd DIR 252,0 4096 919002 /home/anism
bash 1861 anism rtd DIR 252,0 4096 2 /
bash 1861 anism txt REG 252,0 1029720 1048578 /bin/bash
bash 1861 anism mem REG 252,0 47712 655624 /lib/x86_64-linux-gnu/libnss_files-2.19.so
bash 1861 anism mem REG 252,0 47760 655628 /lib/x86_64-linux-gnu/libnss_nis-2.19.so
bash 1861 anism mem REG 252,0 97296 655618 /lib/x86_64-linux-gnu/libnsl-2.19.so
bash 1861 anism mem REG 252,0 39824 655620 /lib/x86_64-linux-gnu/libnss_compat-2.19.so
bash 1861 anism mem REG 252,0 1844160 655565 /lib/x86_64-linux-gnu/libc-2.19.so
bash 1861 anism mem REG 252,0 14664 655581 /lib/x86_64-linux-gnu/libdl-2.19.so
bash 1861 anism mem REG 252,0 167128 655677 /lib/x86_64-linux-gnu/libtinfo.so.5.9
bash 1861 anism mem REG 252,0 150552 655545 /lib/x86_64-linux-gnu/ld-2.19.so
bash 1861 anism mem REG 252,0 26258 133335 /usr/lib/x86_64-linux-gnu/gconv/gconv-modules.cache
bash 1861 anism mem REG 252,0 1607664 136783 /usr/lib/locale/locale-archive
bash 1861 anism 0u CHR 4,1 0t0 8681 /dev/tty1
bash 1861 anism 1u CHR 4,1 0t0 8681 /dev/tty1
bash 1861 anism 2u CHR 4,1 0t0 8681 /dev/tty1
bash 1861 anism 255u CHR 4,1 0t0 8681 /dev/tty1
Display Running Process Statistics
top
The top command used to display all the running and active real-time processes in ordered list and updates it regularly. It display CPU usage, Memory usage, Swap Memory, Cache Size, Buffer Size, Process PID, User, Commands and much more. It also shows high memory and CPU utilization of a running processes.
top
top - 19:24:55 up 2:45, 3 users, load average: 0.00, 0.01, 0.05
Tasks: 417 total, 2 running, 415 sleeping, 0 stopped, 0 zombie
%Cpu(s): 0.2 us, 0.3 sy, 0.0 ni, 99.5 id, 0.0 wa, 0.0 hi, 0.0 si, 0.0 st
KiB Mem: 486484 total, 441184 used, 45300 free, 8888 buffers
KiB Swap: 520188 total, 268 used, 519920 free. 228508 cached Mem
PID USER PR NI VIRT RES SHR S %CPU %MEM TIME+ COMMAND
 2466 root 20 0 23944 3248 2460 R 2.0 0.7 0:00.26 top
 2320 root 20 0 99680 6532 5472 S 0.7 1.3 0:00.96 sshd
 9 root 20 0 0 0 0 R 0.3 0.0 0:00.71 rcuos/1
 387 root 20 0 0 0 0 S 0.3 0.0 0:29.82 kworker/0:2
 1527 root 20 0 278860 22404 16924 S 0.3 4.6 0:00.55 apache2
 2248 root 20 0 74876 35572 4776 S 0.3 7.3 0:33.16 nikto.pl
 2419 root 20 0 0 0 0 S 0.3 0.0 0:00.71 kworker/u256:0
 1 root 20 0 29060 3728 2492 S 0.0 0.8 0:02.00 init
 2 root 20 0 0 0 0 S 0.0 0.0 0:00.00 kthreadd
 3 root 20 0 0 0 0 S 0.0 0.0 0:08.18 ksoftirqd/0
 5 root 0 -20 0 0 0 S 0.0 0.0 0:00.00 kworker/0:0H
 7 root 20 0 0 0 0 S 0.0 0.0 0:01.64 rcu_sched
 8 root 20 0 0 0 0 S 0.0 0.0 0:00.79 rcuos/0
 10 root 20 0 0 0 0 S 0.0 0.0 0:00.00 rcuos/2
 11 root 20 0 0 0 0 S 0.0 0.0 0:00.00 rcuos/3
 12 root 20 0 0 0 0 S 0.0 0.0 0:00.00 rcuos/4
 13 root 20 0 0 0 0 S 0.0 0.0 0:00.00 rcuos/5
 14 root 20 0 0 0 0 S 0.0 0.0 0:00.00 rcuos/6
 15 root 20 0 0 0 0 S 0.0 0.0 0:00.00 rcuos/7
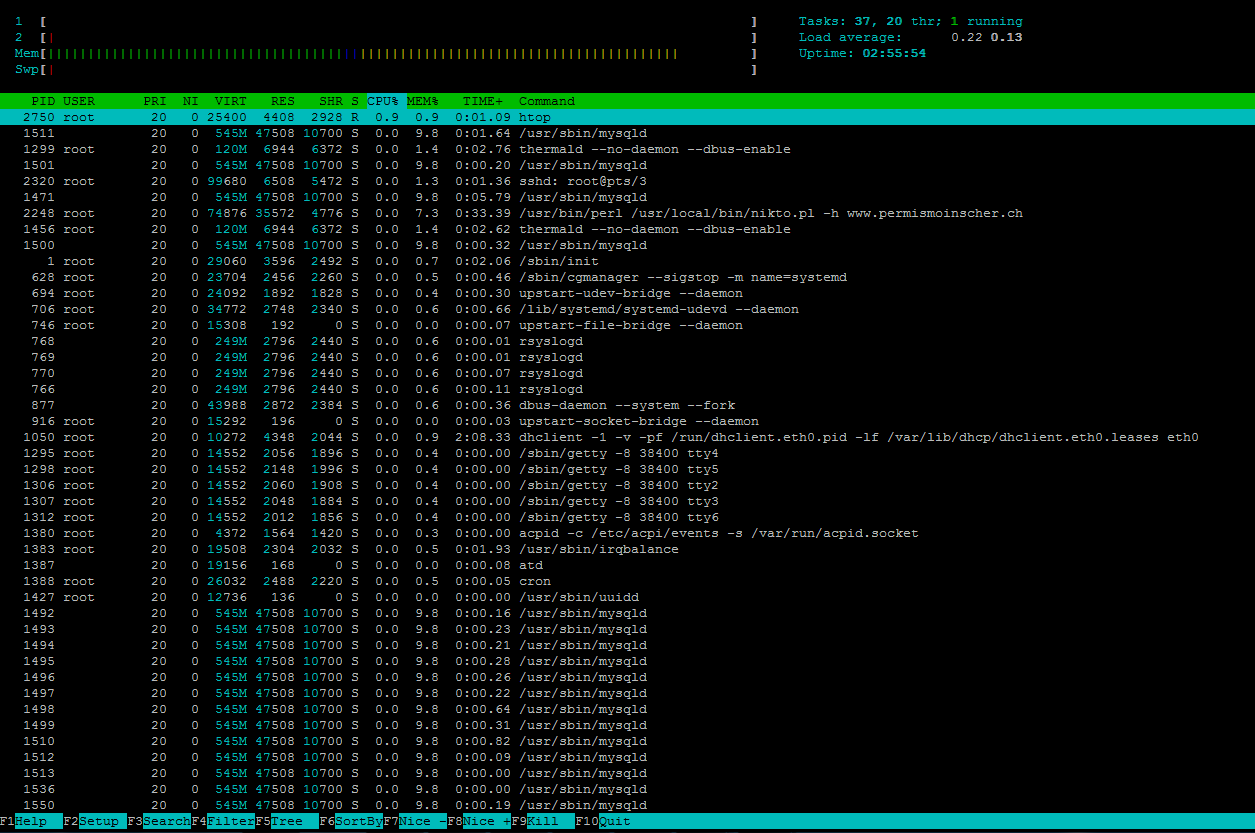
htop
htop is a interactive process viewer in UNIX like operating system.Htop is a free (GPL) ncurses-based process viewer for Linux.It is similar to top, but allows you to scroll vertically and horizontally, so you can see all the processes running on the system, along with their full command lines.Tasks related to processes (killing, renicing) can be done without entering their PIDs.
If the program ‘htop’ is currently not installed. You can install it by typing on ubuntu:
apt-get install htop
To install htop on Centos , type the following:
yum install htop
htop output consists of three sections :
Section 1 : Header shows the CPU usage , Memory usage & Swap usage along with Load average and uptime of linux box.
Section 2 : Body shows the list of processes sorted by %CPU usage.
Section 3 : Footer displays htop menu commands.
Display Logged Users
W
w displays information about the users currently on the machine, and their processes. The header shows, in this order, the current time, how long the system has been running, how many users are currently logged on, and the system load averages for the past 1, 5, and 15 minutes.
w
19:26:43 up 2:47, 3 users, load average: 0.02, 0.02, 0.05
USER TTY FROM LOGIN@ IDLE JCPU PCPU WHAT
anism tty1 16:41 2:45m 0.12s 0.10s -bash
root pts/1 192.168.28.1 17:49 1:34m 33.30s 33.23s mkdir
root pts/3 192.168.28.1 18:40 3.00s 1.50s 0.09s w
Display Bandwidth Statistics
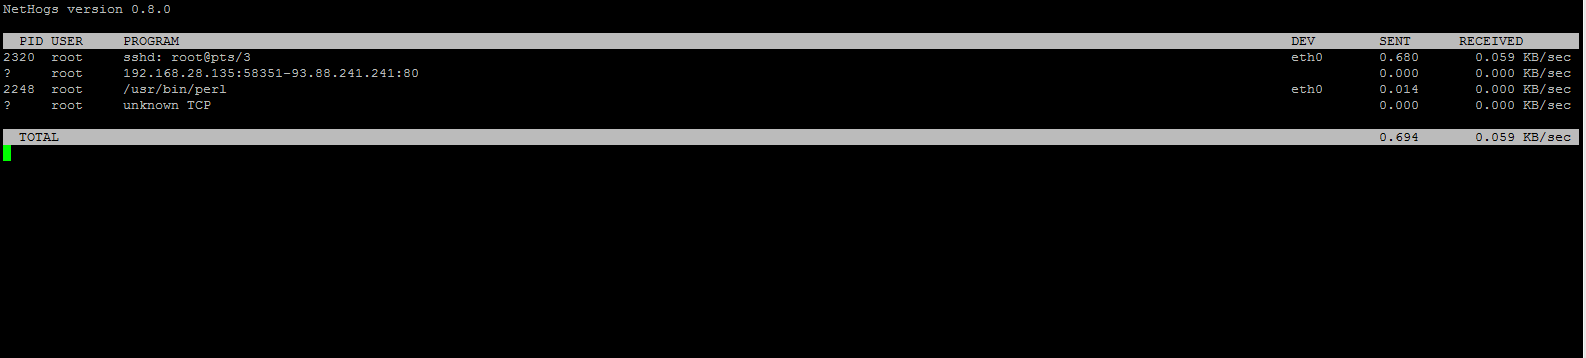
NetHogs
nethogs is a small ‘net top’ tool. Instead of breaking the traffic down per protocol or per subnet, like most tools do, it groups bandwidth by process.
On Ubuntu, you can install nethogs with the following command:
apt-get install nethogs
On Centos , you can install it with is command:
yum install nethogs
You can run it by typing:
nethogs
The following example shows nethogs output.
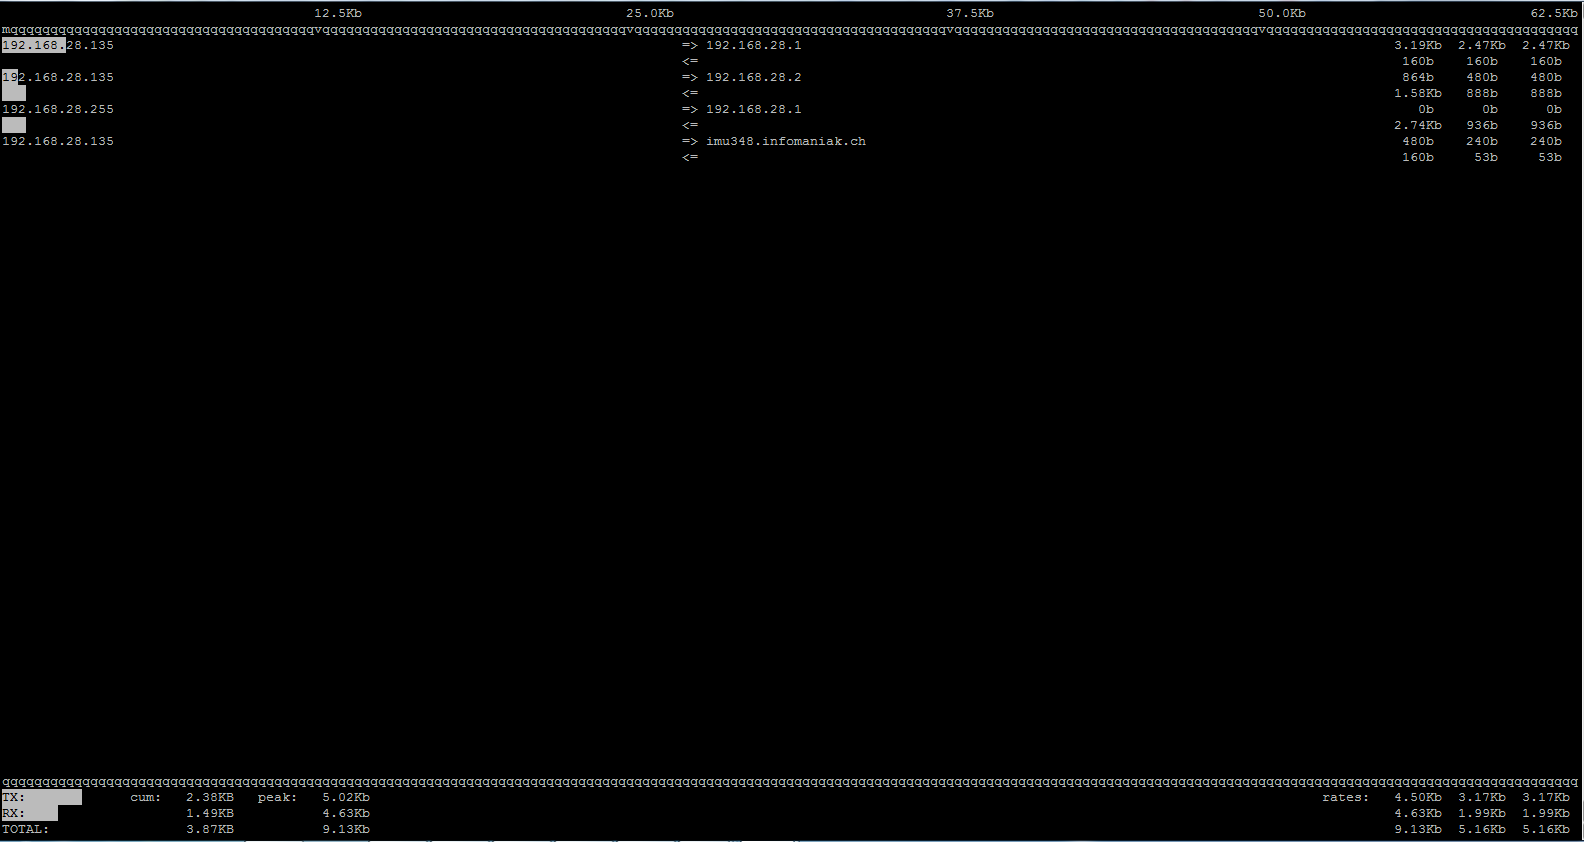
iftop
iftop is another terminal-based free open source system monitoring utility that displays a frequently updated list of network bandwidth utilization (source and destination hosts) that passing through the network interface on your system.
On Ubuntu, you can install iftop with the following command:
sudo apt-get install iftop
To run the program, simply call it from the command line with root privileges:
sudo iftop
The following example shows iftop command output.
netstat
netstat is a useful tool for checking your network configuration and activity. It is in fact a collection of several tools lumped together. netstat – Print network connections, routing tables, interface statistics, masquerade connections, and multicast memberships
$ netstat
Active Internet connections (w/o servers)
Proto Recv-Q Send-Q Local Address Foreign Address State
tcp 0 0 192.168.28.135:ssh 192.168.28.1:65250 ESTABLISHED
tcp 0 64 192.168.28.135:ssh 192.168.28.1:49665 ESTABLISHED
tcp 0 1 192.168.28.135:58401 imu348.infomaniak.:http SYN_SENT
Active UNIX domain sockets (w/o servers)
Proto RefCnt Flags Type State I-Node Path
unix 8 [ ] DGRAM 585 /dev/log
unix 3 [ ] STREAM CONNECTED 11370 /var/run/dbus/system_bus_socket
unix 3 [ ] DGRAM 10846
unix 3 [ ] STREAM CONNECTED 11722
unix 3 [ ] STREAM CONNECTED 550
unix 2 [ ] DGRAM 845
unix 3 [ ] STREAM CONNECTED 10798
unix 3 [ ] STREAM CONNECTED 14700 /var/run/dbus/system_bus_socket
unix 2 [ ] DGRAM 12359
unix 2 [ ] DGRAM 19692
unix 2 [ ] DGRAM 11362
unix 3 [ ] STREAM CONNECTED 802 @/com/ubuntu/upstart
unix 3 [ ] DGRAM 10845
unix 3 [ ] STREAM CONNECTED 768
unix 3 [ ] STREAM CONNECTED 800
unix 2 [ ] DGRAM 19325
unix 2 [ ] DGRAM 14644
unix 3 [ ] STREAM CONNECTED 11367
unix 3 [ ] STREAM CONNECTED 552 @/com/ubuntu/upstart
unix 3 [ ] STREAM CONNECTED 11368
unix 3 [ ] STREAM CONNECTED 15576
unix 3 [ ] STREAM CONNECTED 501 @/com/ubuntu/upstart
unix 3 [ ] STREAM CONNECTED 11723 /var/run/dbus/system_bus_socket
That’s all for this article.
If we’ve missed any important tool that you would like us to include in this list, please inform us via comments and please don’t forget to share it. Enjoy


