
The Linux monitoring systems are often used to follow system resources, such as CPU load, the amount of free RAM, network traffic statics or memory consumption. Which are ones from the most important tasks for every administrators. Furthermore, those tools notify the network administrator (via email, SMS or other alarms) when something interrupts or goes down which makes their life easier.
From those monitoring tools we will list the 7 most important in this article which will be described and identified by giving their features and mentioning their current version.
Nagios:
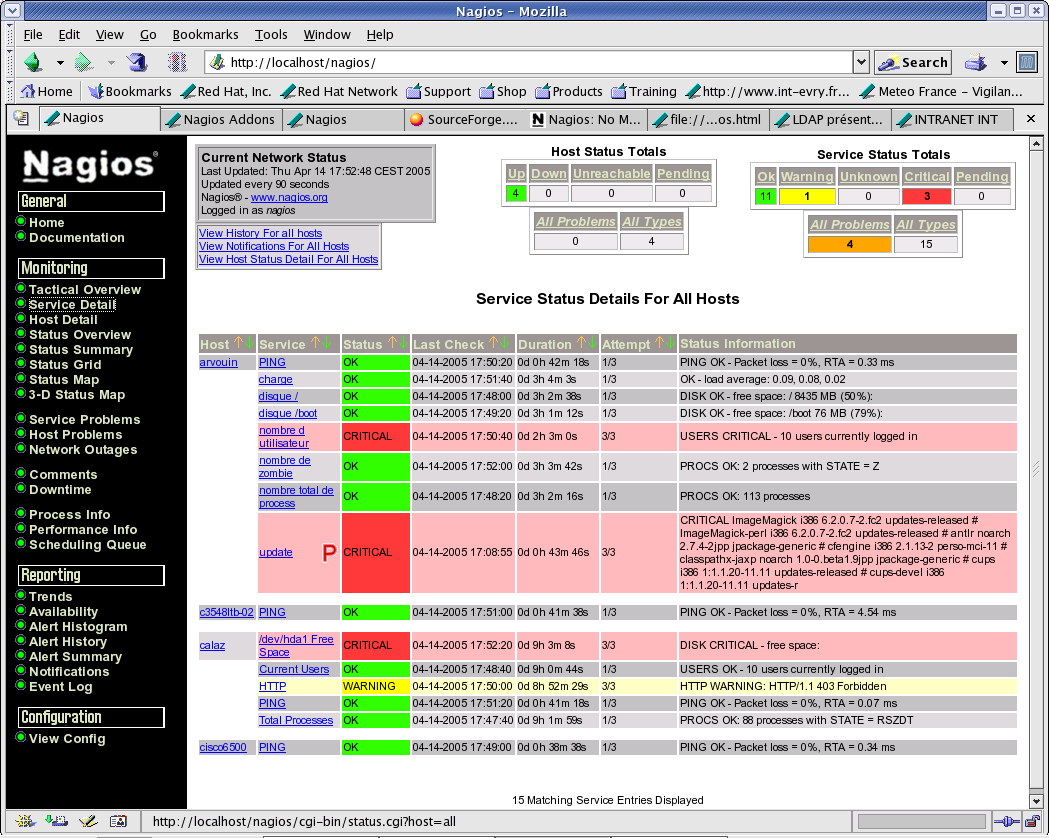
One from the most known, open source, powerful monitoring systems nowadays is Nagios. It enables organizations to identify and resolve IT infrastructure problems before affecting critical business processes.
Nagios is licensed under GNU General Public License which gives you permission to copy, broadcast and/or change it under certain conditions obviously. For more details, you can check the license as either as by using the LICENSE file of the Nagios distribution or by reading the online version of license.
Concerning its features we can list the following:
- Monitor network services (SMTP, POP3, HTTP, NNTP, and PING), applications, operating systems, network protocols and system metrics with the same tool.
- Detect infrastructure outages rapidly and send e-mail, SMS or call phone notifications to the right people when a problem is detected.
- Define network host hierarchy
- Users can easily develop their own services due to the simple plugin design of Nagios.
- Ability to check the current network status, notifications and problem history
- Open source software, full access to source code, licensed under GPL.
Seriously, Nagios is one awesome IT infrastructure monitoring tool which I strongly recommend it for every administrator wishes to make his work easier and organized but it is good also to use it with other monitoring tools since Nagios doesn’t show any graphs such as the network interface.
Cacti:
Cacti is another monitoring system licensed also under GPL but unlike Nagios, Cacti is a network graphing solution designed to exploit the power of RRDTool in storing data and building graphs.
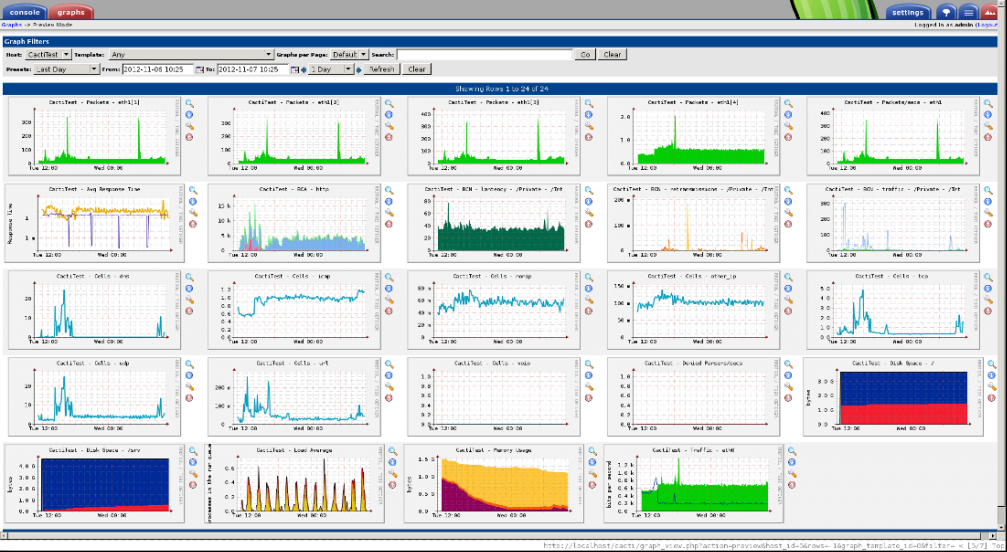
It enables users to view CPU load graphs, RAM usage and other information collected from different hosts. Like Nagios, Cacti supports SNMP that makes it possible to monitor: Linux’s, BSD’s and windows hosts.
We can list the following features of Cacti:
- Unlimited number of graph items.
- Graph data can be manipulated using the CDEF math functions built in RRDTools.
- Support all RRDTool’s graph items including AREA, STACK, LINE, COMMENT, VRULE, and HRULE.
- Data sources can be created by utilizing RDDTool’s functions.
- Permissions can be specified per-graph for each user.
But unlike Nagios, Cacti doesn’t notify users while problems appear so it is recommended to use other flexible tools supporting alerts.
Centreon:
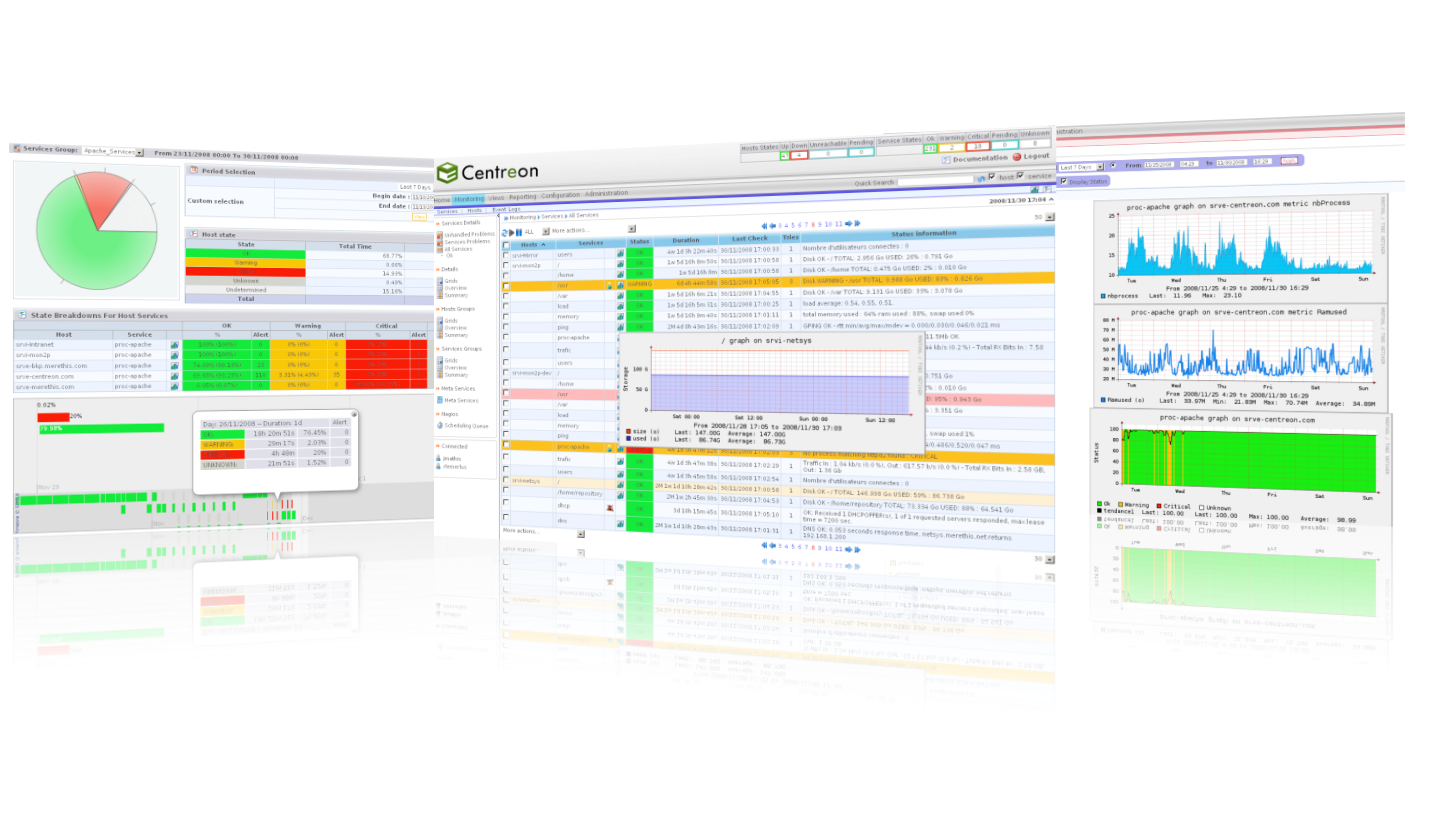
Centreon is our third type of free monitoring systems. Mostly called CES referencing to the Centreon Enterprise Server, is the choice of some world’s largest company. It lets company supervise all their infrastructure and applications comprising their information system.
Centreon has many advantages, we can list the following:
- Enable to monitor the user’s servers, active elements and applications.
- Real-time operating and component management console.
- Ability to maintain and support the whole platform using the publisher solution.
- Unlimited number of uses and extensions via open software mechanisms.
Currently there are 4 different solutions available to suit different organizations with evolving business needs.
- The CES Standard is the only open and unlimited trial version. Unless it has a free access, a powerful industry-standard monitoring solution is offered.
- CES Essentials is CES Standards including access to new software products and services such as Platinum level supports and various software extensions which allow users to automate the daily tasks of administration and monitoring.
- CES Advanced is CES Essentials adding also the Centreon’s complementary plugin pack and different templates comprising databases, applications and infrastructure services.
- The last one is CES Complete which is the mix of all the centreon software products and modules, including BI, BAM and Map. It is also delivered with Platinum level support.
Zabbix :
Zabbix is our fourth free monitoring system which is licensed as Nagios and Cacti under GPL and it is written in PHP. We can say that Zabbix is the mix of Nagios and Cacti functions: it is characterized by its simple way of monitoring data with graphs and its alerts sending to user in case of any problem.
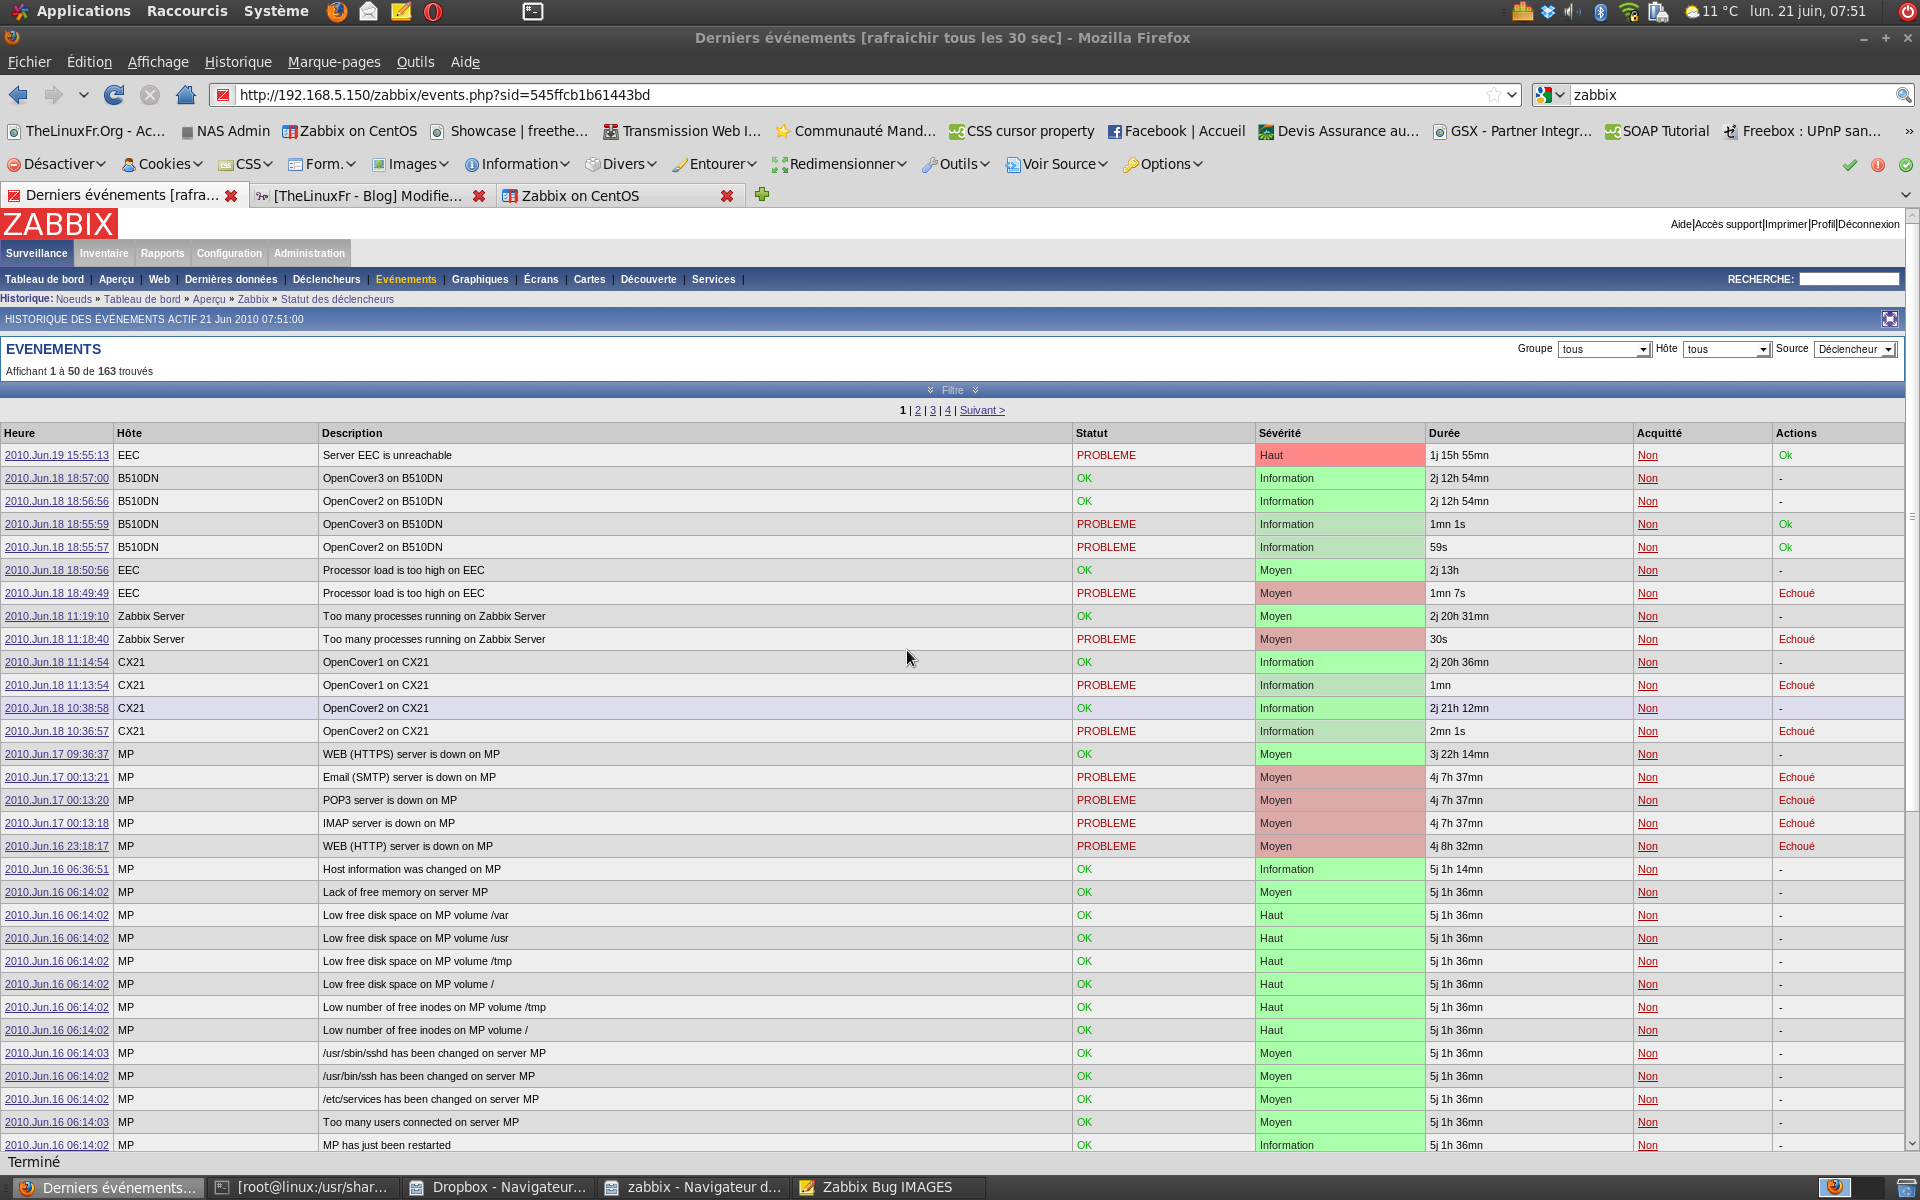
Personally, I like the way how Zabbix can check and make report about every authorized or not change happen at one of the user’s servers. This free monitoring tool, can from remote hosts where Zabbix is used. It offers different types of graphs such as network statistics, CPU load and others.
It is a little bit complicate for beginners and some additional time to be familiar with this monitoring system is recommended.
Zabbix as I mentioned offers the functions of Nagios and Cacti at same time, we can list the following features of this tool:
- It is fully open source, free for commercial and non-commercial use.
- It enables users to easily monitor their servers, network devices and applications, collecting appropriate statistics and performance data.
- It is designed to scale from small environments with a few devices to large ones with thousands of monitored devices.
- Like Nagios, it can send notification messages via e-mail, SMS for each notable event.
OpenNMS:
OpenNMS is another free network monitoring system and it is the world’s first enterprise grade monitoring tool which can be used a big number of unlimited devices. It enables users to discover and monitor services or nodes automatically in their network.
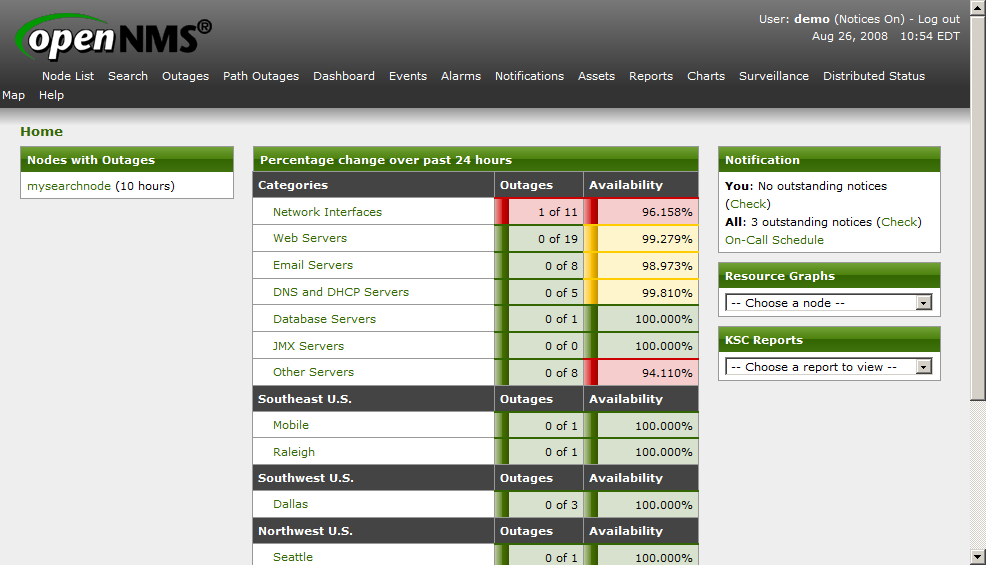
OpenNMS has many advantages make it a very beneficial free network monitoring tool when we can list the following:
- Automatic Service Discovery and Provisioning
- Performance Data Collection Protocols (such as HTTP, JDBC, JMX, SNMP, XML etc)
- Multi-Resource Performance Reports
- Best Practical Solutions RT (Request Tracker)
- Import of nodes, interfaces, and services from external provisioning system
- Performance Data Export via simple XML Schema
- Possibility to send e-mail or SMS notifications to the administrators
Icinga:
Icinga is another enterprise grade free monitoring system which enables users to follow network and its resources and also notifies them when any problem appear. This tool can monitor as either as complex or large environments across various locations.
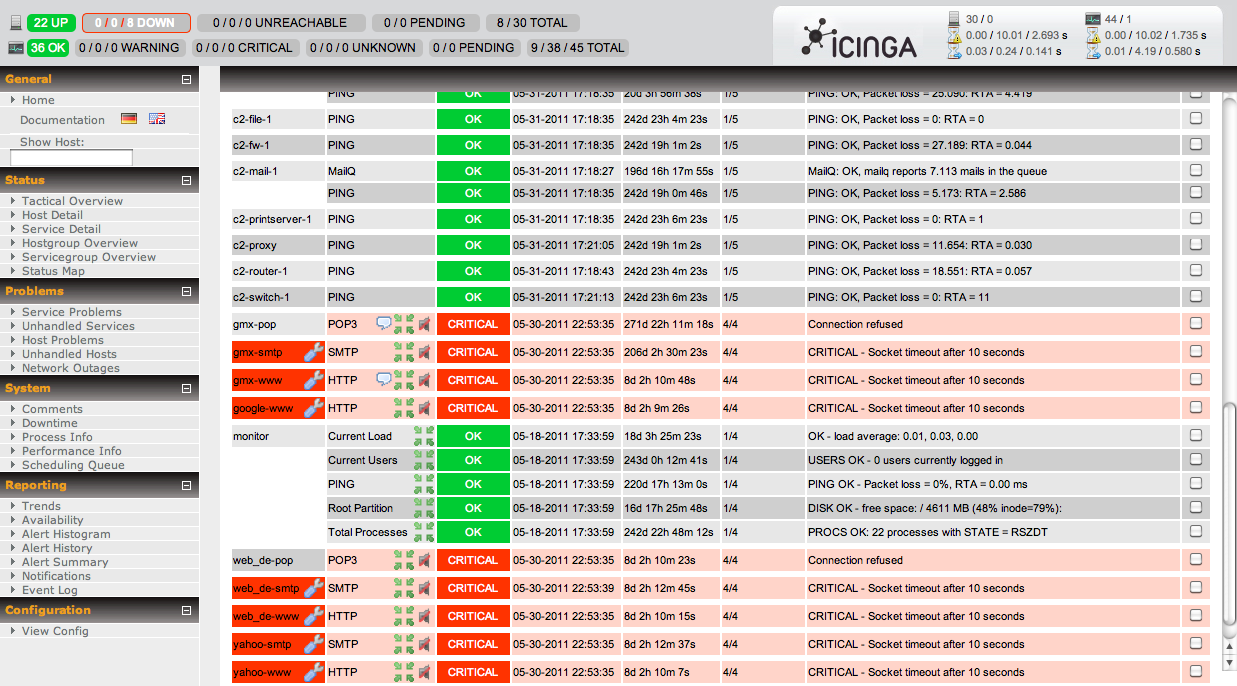
Some of its various features include:
- Its capability to monitor different network services (SMTP, POP3, HTTP, NNTP, PING…)
- Also monitor host resources (CPU load, disk usage…)
- It allows users to easily develop their own services checks due to its simple plugin design.
- It has support for monitoring redundant monitoring hosts.
- It notifies users when service or host problems occur and when they also get resolved.
MRTG:
MRTG (Multi Router Traffic Grapher) is our last type of free monitoring system. It is simpler than Nagios, Cacti and Zabbix which can be more beneficial to use it with small projects. Mostly, it is used for monitoring network interfaces, CPU, memory and network interfaces statistics.
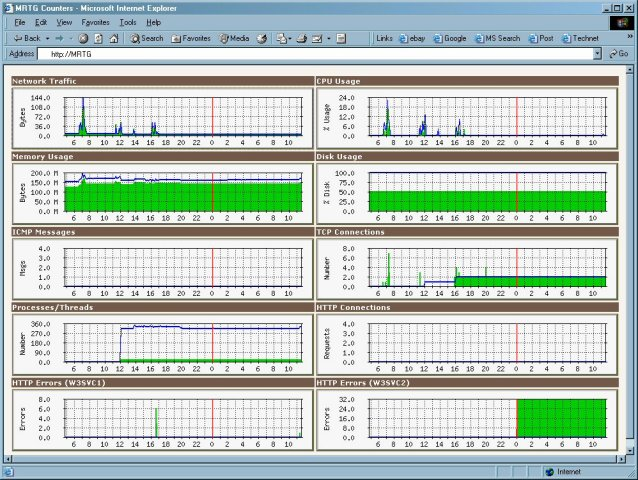
Regarding its features, we can list the following:
- It works on most UNIX platforms and Windows NT.
- It is written with Perl and delivered with full source.
- No need to install any external SNMP package since MRTG uses a highly portable SNMP implementation written fully in Perl.
- It creates visual representations of the traffic seen during the last week, month and year.
- It is possible to monitor 200 or more network links from any halfway decent UNIX box.
- It is also possible to monitor any SNMP and to assemble to data sources in one graph.
The description of our selected free monitoring systems in this article now is finished. Of course, there are other tools we don’t mention, if you want to include them in our article please feel free to leave a comment here with a brief description of the suggested tools. Thank you for reviewing our article and please don’t forget to share it.


