
Nagios is an open source software that can be used for network and infrastructure monitoring. Nagios will monitor servers, switches, applications and services. It alerts the System Administrator when something went wrong and also alerts back when the issues has been rectified.
With Nagios you can:
– Monitor your entire IT infrastructure.
– Identify problems before they occur.
– Know immediately when problems arise.
– Share availability data with stakeholders.hypothetical question
– Detect security breaches.
– Plan and budget for IT upgrades.
– Reduce downtime and business losses.
Scenario
In this tutorial i am going to use two systems as mentioned below.
Nagios server:
Operating system : CentOS 6.5 minimal installation
IP Address       : 192.168.1.101/24
Nagios client:
Operating System : Ubuntu 13.04
IP Address       : 192.168.1.100/24
Prerequisites
Before installing Nagios, make sure that you’ve a properly installed and configured LAMP stack in your server. To install and configure LAMP server, refer any one of the following links.
– Install LAMP server On CentOS/RHEL/Scientific Linux 6
Also install the following prerequisites too. All commands should be run as root user.
# yum install gd gd-devel gcc glibc glibc-common
Install Nagios
I tested this how-to on CentOS 6.5 minimal server, although it should work on all RHEL 6.x and its clones like CentOS 6.x and Scientific Linux 6.x.
Nagios will not be found in CentOS official repositories, so let us add the EPEL repository to install nagios. To add and enable EPEL repository, refer the following link.
– Install EPEL Repository On CentOS/RHEL/Scientific Linux 6
Next install nagios with all plug-ins and nagios agents(nrpe-agent) using command:
# yum install nagios*
Note: It worked for me either if i keep SELINUX and iptables enable or disable. All you need to do is allow the apache port through iptables as shown below.
# vi /etc/sysconfig/iptables
Add the following line:
[...]
-A INPUT -m state --state NEW -m tcp -p tcp --dport 80 -j ACCEPT
[...]
Save and close the file. Restart iptables.
# service iptables restart
Configure Nagios
Add the admin mail address in the nagios contact file to receive alerts from nagios server. To do that edit file /etc/nagios/objects/contacts.cfg,
# vi /etc/nagios/objects/contacts.cfg
Find the following line and enter the email id:
[...]
email                           sk@unixmen.com ;
[...
Save and close the file. Then Edit file /etc/httpd/conf.d/nagios.conf,
# vi /etc/httpd/conf.d/nagios.conf
And edit the following lines if you want to access nagios administrative console from a particular IP series. Here i want to allow nagios administrative access from 192.168.1.0/24 series only.
[...]
## Comment Lines 15 & 16 ##
#   Order allow,deny
#   Allow from all

## Uncomment and Change lines 17,18 & 19 as shown below ##
Order deny,allow
Deny from all
Allow from 127.0.0.1 192.168.1.0/24
[...]
Set nagiosadmin password
# htpasswd /etc/nagios/passwd nagiosadmin
New password:
Re-type new password:
Updating password for user nagiosadmin
Start nagios and httpd services and let them to start automatically on every boot.
# service nagios start
# service httpd start
# chkconfig nagios on
# chkconfig httpd on
Access Nagios admin console
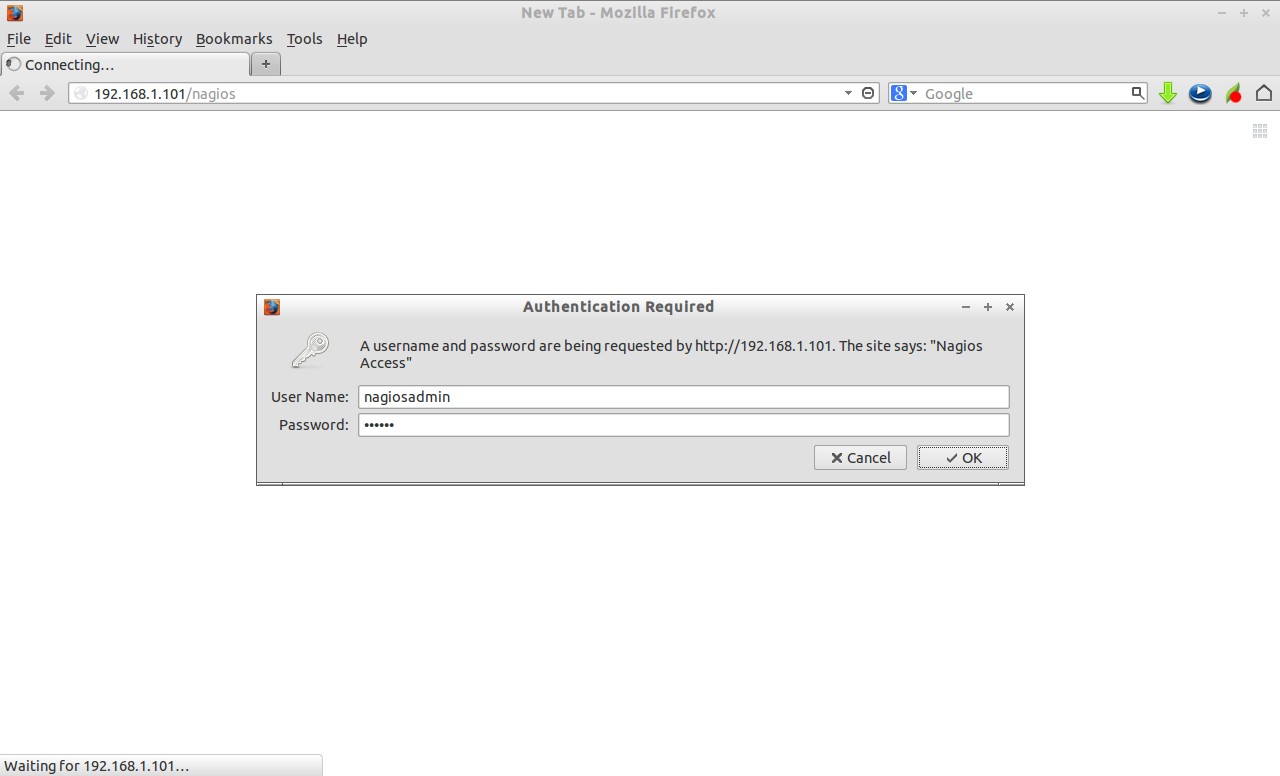
Open nagios administrator console with URL http://nagios-server-ip/nagios and enter the username as nagiosadmin and its password which we created in the earlier steps.
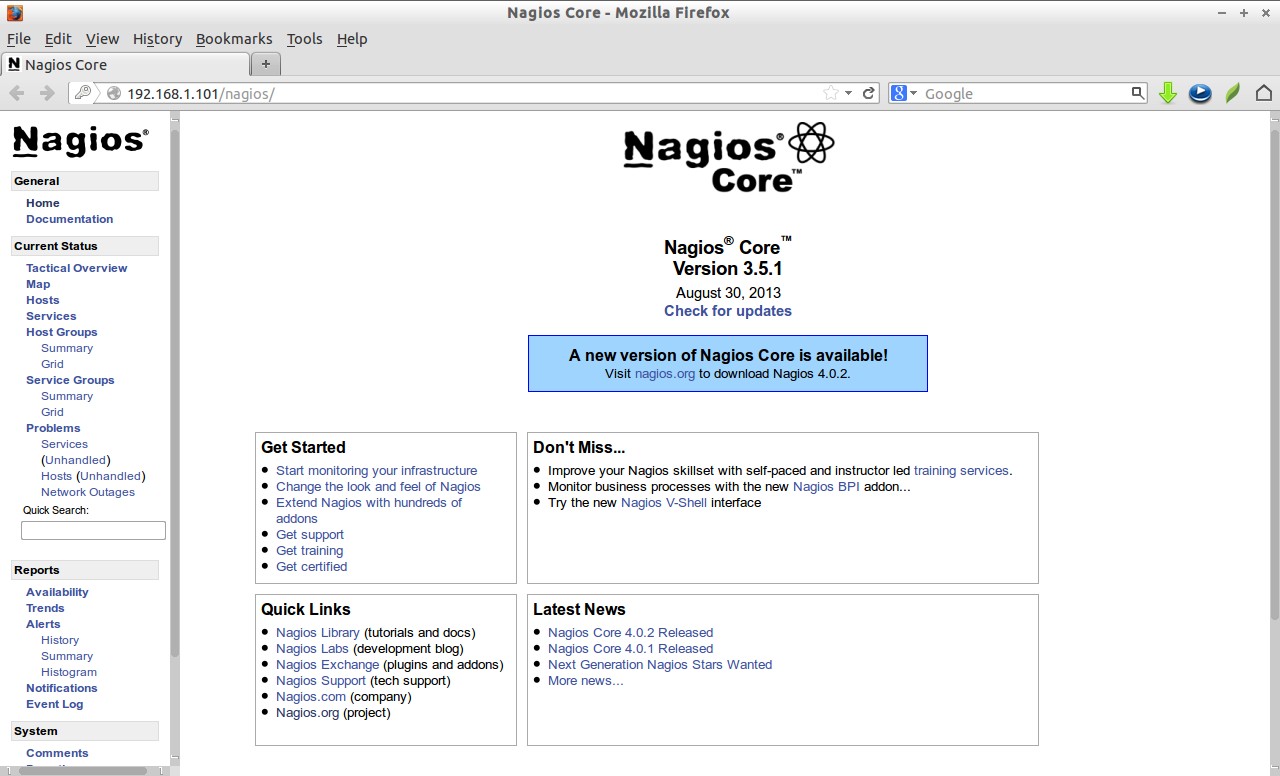
 This is how Nagios administrative console looks:
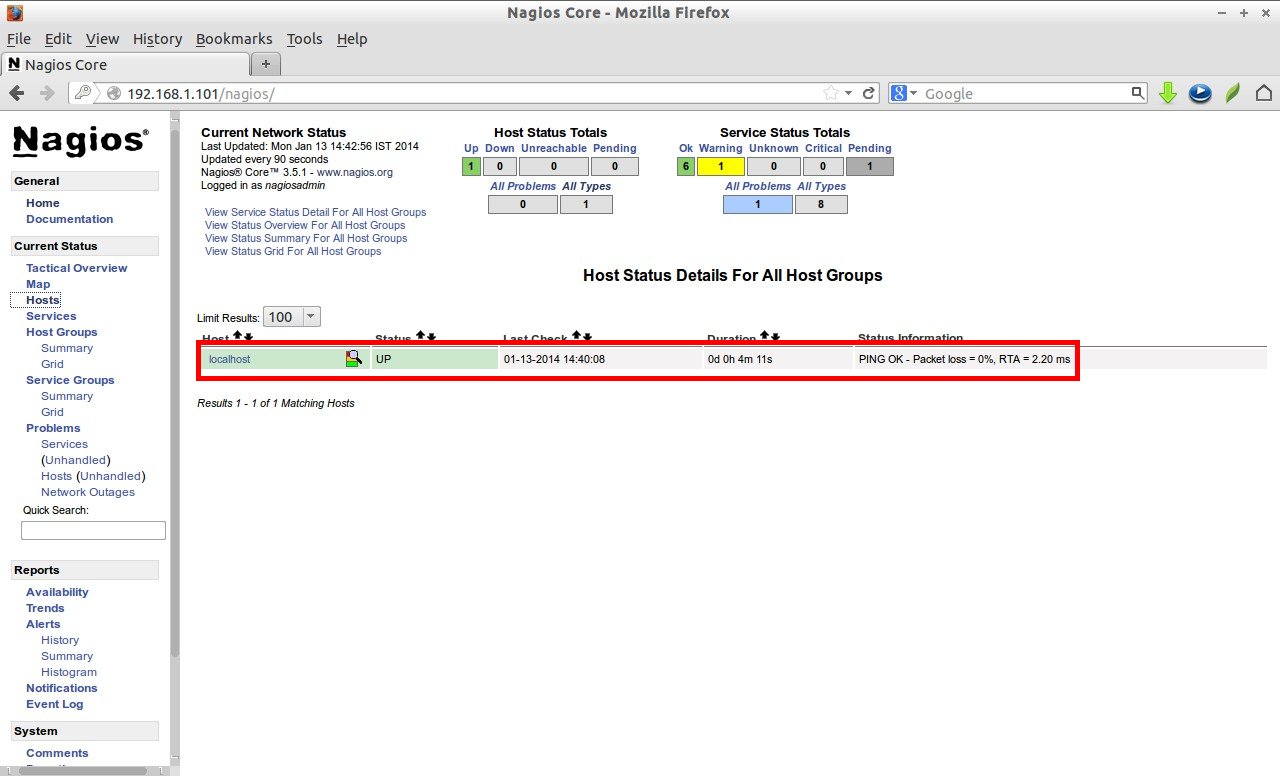
 Click on the “Hosts” section in the left pane of the console. You will see the no of hosts to be monitored by Nagios server. Initially, the nagios server (localhost) itself will only be monitored.
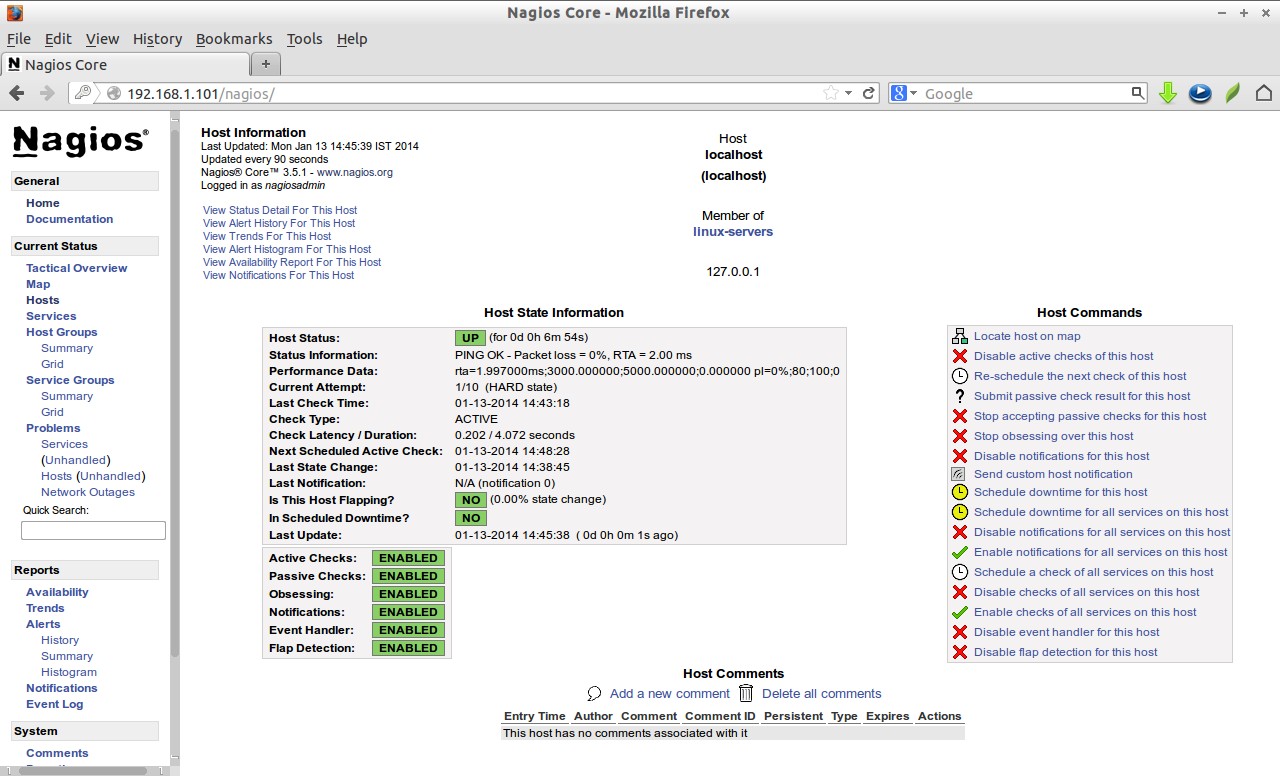
 Click on the monitoring host to display more details:
Add Monitoring targets to Nagios server
Now let us add some clients to monitor by Nagios server. To do that we have to install nrpe and nagios-plugins in our monitoring targets.
On CentOS/RHEL/Scientifc Linux clients:
Like i said before, you have to add EPEL repository in your CentOS/RHEL/Scientific Linux 6.x clients to install nrpe package.
Install “nrpe” and “nagios-plugins” packages in client systems to be monitored.
# yum install nrpe nagios-plugins-all openssl
On Debian/Ubuntu clients:
$ sudo apt-get install nagios-nrpe-server nagios-plugins
Configure Monitoring targets
Edit /etc/nagios/nrpe.cfg file,
# vi /etc/nagios/nrpe.cfg
Add your Nagios server ip address
[...]
## Line 81 - Add the Nagios server IP ##
allowed_hosts=127.0.0.1 192.168.1.101
[...]
Start nrpe service:
# service nrpe start
# chkconfig nrpe on
For Debian/Ubuntu Clients, start nrpe service as shown below.
$ sudo /etc/init.d/nagios-nrpe-server restart
Now go back to your Nagios server to add the clients to be monitored through nagios server. Edit “/etc/nagios/nagios.cfg” file,
# vi /etc/nagios/nagios.cfg
and uncomment the following lines.
## Line 52 - Uncomment ##
cfg_dir=/etc/nagios/servers
Create a directory called “servers” under “/etc/nagios/”.
# mkdir /etc/nagios/servers
Create config file to the client to be monitored:
# vi /etc/nagios/servers/clients.cfg
define host{

use                             linux-server

host_name                       client

alias                           client

address                         192.168.1.100

max_check_attempts              5

check_period                    24x7

notification_interval           30

notification_period             24x7

}
Finally restart nagios service.
# service nagios restart
Now open the nagios admin console in the browser and navigate to “Hosts” section in the left pane. You will see the newly added client will be visible there. Click on the host to see if there is anything wrong or alerts.
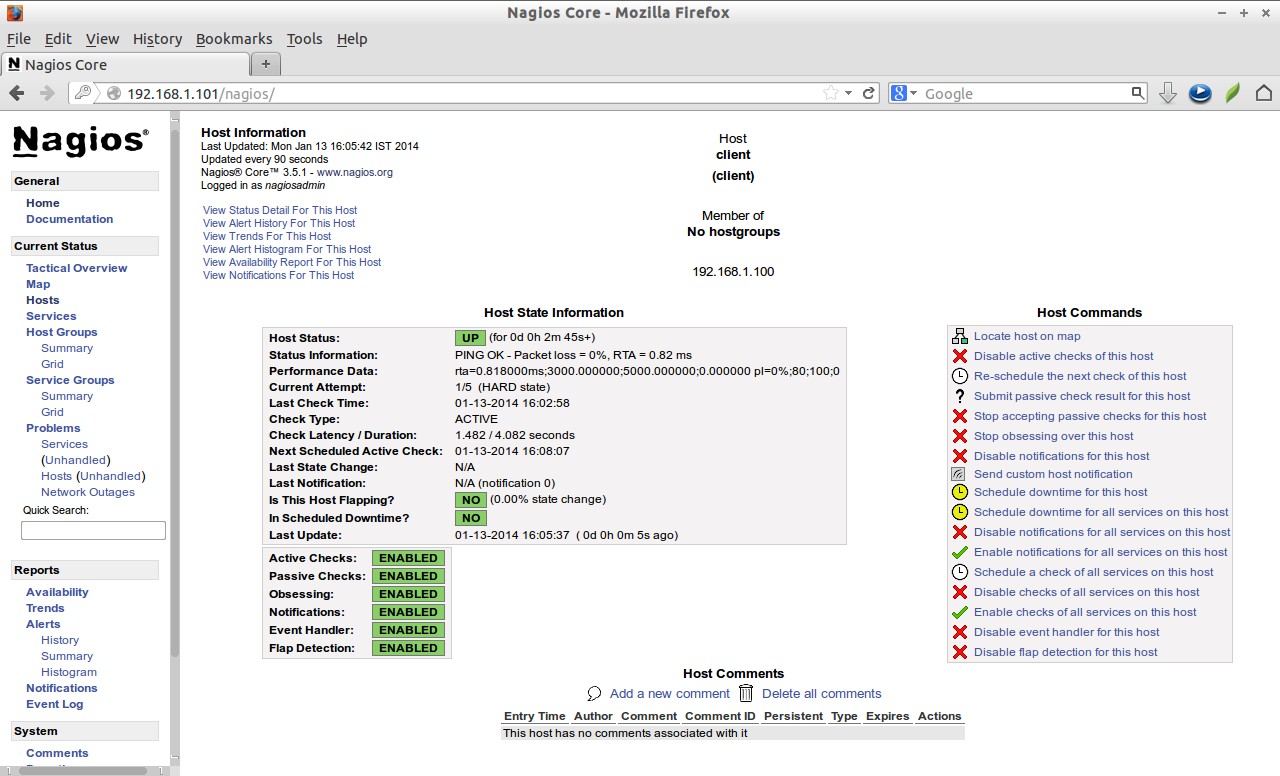
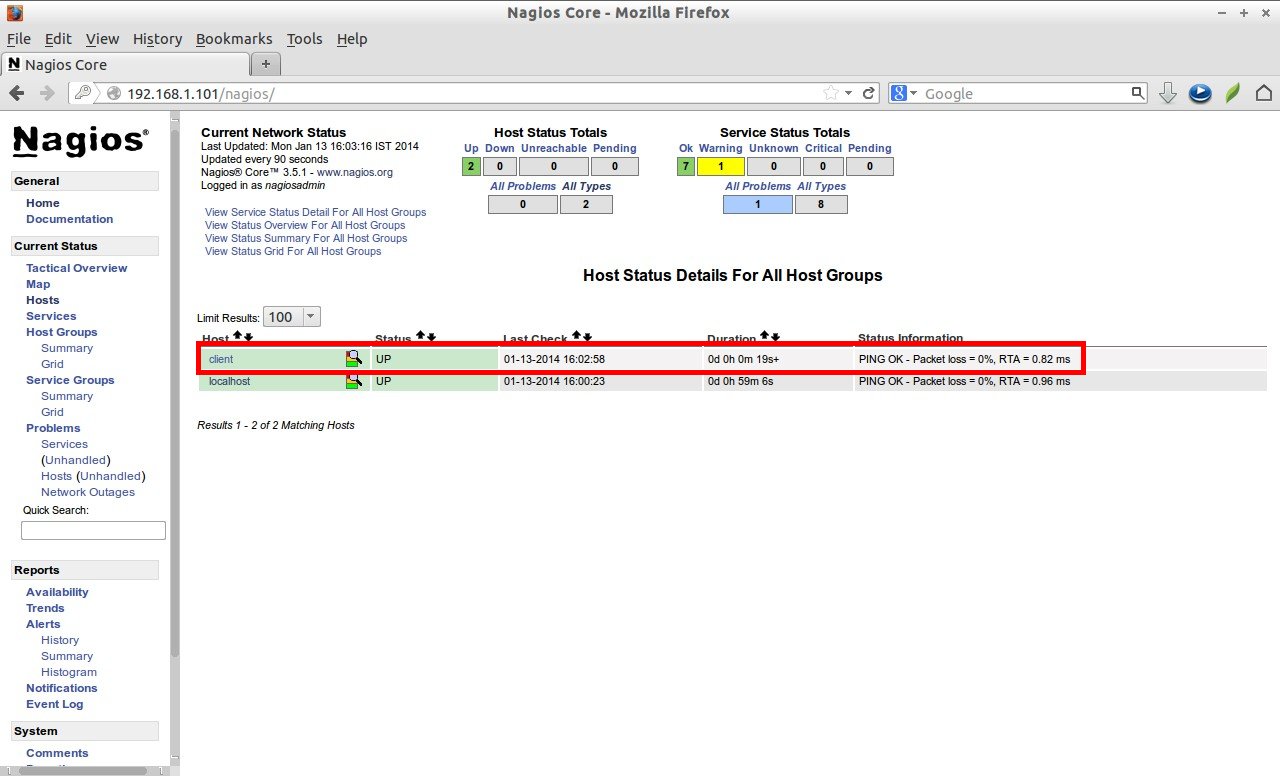 Click on the monitoring target, you’ll get the detailed output:
 Like this way, you can define more clients by creating a separate config files “/etc/nagios/servers directory for each client.
Define services
We did define the monitoring host before. Now let us add some services of the monitoring host. For example to monitor the ssh service, add the following lines shown in red colour in the /etc/nagios/servers/clients.cfg file.
# vi /etc/nagios/servers/clients.cfg
define host{

use                             linux-server

host_name                       client

alias                           client

address                         192.168.1.100

max_check_attempts              5

check_period                    24x7

notification_interval           30

notification_period             24x7

}

define service {
        use                             generic-service
        host_name                       client
        service_description             SSH
        check_command                   check_ssh
        notifications_enabled           0
        }
Save and close the file. Restart Nagios.
# service nagios restart
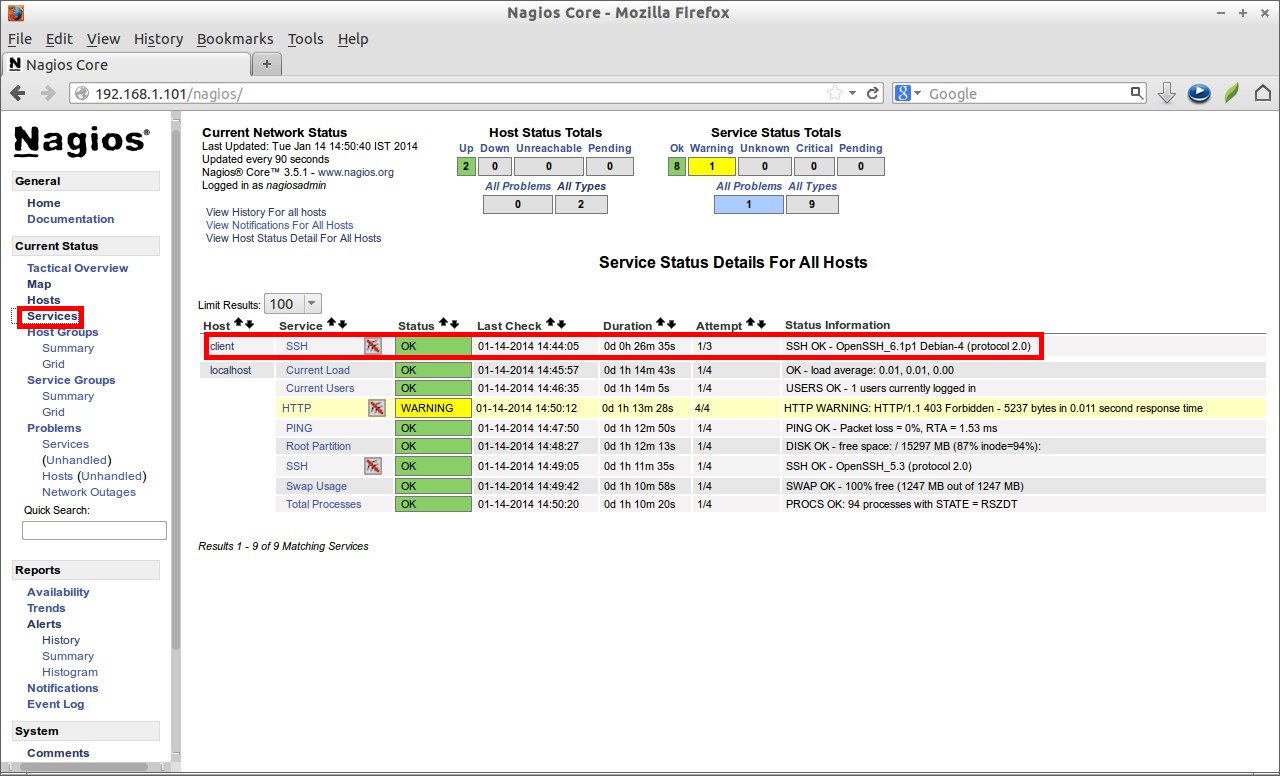
Now log in to Nagios web console and check for the added services. Navigate to Services section, you’ll see the ssh service there.
 To know more about object definitions such as Host definitions, service definitions, contact definitions and more please do visit here. This page will describe you the description and format of all object definitions.
That’s all about now. Good Luck! Stay healthy!
You might want to check Nagios 4 installation on CentOS 7.
Reference Links:


