
Introduction
Cacti is an open source web based network monitoring tool front-end for the data logging tool called RRDtool. It’s allow users to check the services at an interval of time and resulting in the graph format.
For more information, you can visit the website of Cacti.
This article is intended for use by Cacti Administrators who want to monitor VMware ESXi Hosts Using Cacti.
If you haven’t installed Cacti yet, check the following article.
On Ubuntu based systems:
On RPM based systems:
This tutorial explains the process to monitor your linux servers with Cacti and SNMP.
In this article we will show you how to install and configure SNMP in the remote server and how to add the host to Cacti.
Enable SNMP Monitoring on VMware ESXi Hosts
Before you start Cacti configuration to monitor Esxi, you need to enable SNMP on the host. ESXi has an SNMP agent which allows the host to send SNMP traps and got polling requests.
To enable SNMP on ESXi host, type the the following commands.
esxcli system snmp set --communities SNMP_STRING
esxcli system snmp set --enable true
esxcli network firewall ruleset set --ruleset-id snmp --allowed-all true
esxcli network firewall ruleset set --ruleset-id snmp --enabled true
/etc/init.d/snmpd restart
You need to replace SNMP_STRING with your community string. Also ,y ou can change the firewall rule to only allow a specific subnet or host if you would like to.
esxcli network firewall ruleset set --ruleset-id snmp --allowed-all false
esxcli network firewall ruleset allowedip add --ruleset-id snmp --ip-address 10.80.101.0/24
esxcli network firewall ruleset set --ruleset-id snmp --enabled true
/etc/init.d/snmpd restart
Use snmpwalk command to test that the snmpd service work fine like this example:
$ <strong>snmpwalk -v 1 -c SNMP_STRING ip-address-of -exi-host

</strong>

SNMPv2-MIB::sysDescr.0 = STRING: VMware ESXi 5.5.0 build-1331820 VMware, Inc. x86_64

SNMPv2-MIB::sysObjectID.0 = OID: SNMPv2-SMI::enterprises.6876.4.1

DISMAN-EVENT-MIB::sysUpTimeInstance = Timeticks: (12300) 0:02:03.00

SNMPv2-MIB::sysContact.0 = STRING:

SNMPv2-MIB::sysName.0 = STRING: cloud1.1on1.com

SNMPv2-MIB::sysLocation.0 = STRING:

SNMPv2-MIB::sysServices.0 = INTEGER: 72

SNMPv2-MIB::sysORLastChange.0 = Timeticks: (0) 0:00:00.00

SNMPv2-MIB::sysORID.1 = OID: SNMPv2-MIB::snmpMIB

SNMPv2-MIB::sysORID.2 = OID: IF-MIB::ifMIB

SNMPv2-MIB::sysORID.3 = OID: IP-MIB::ip

SNMPv2-MIB::sysORID.4 = OID: IP-FORWARD-MIB::ipForward

SNMPv2-MIB::sysORID.5 = OID: UDP-MIB::udp

SNMPv2-MIB::sysORID.6 = OID: TCP-MIB::tcp

SNMPv2-MIB::sysORID.7 = OID: SNMPv2-SMI::mib-2.47

…
Add VMware ESXi Hosts on Cacti
Before you add new host to Cacti , you need to configure ESXi host template. You will not have time to develop one, but there are plenty of things that you can monitor on an ESXi host using default standard Cacti templates. With this template you will be able to begin graphing my datastores space used, network interfaces, users logged in, and memory consumed.
So first step to do is to download this template from this link to your pc.
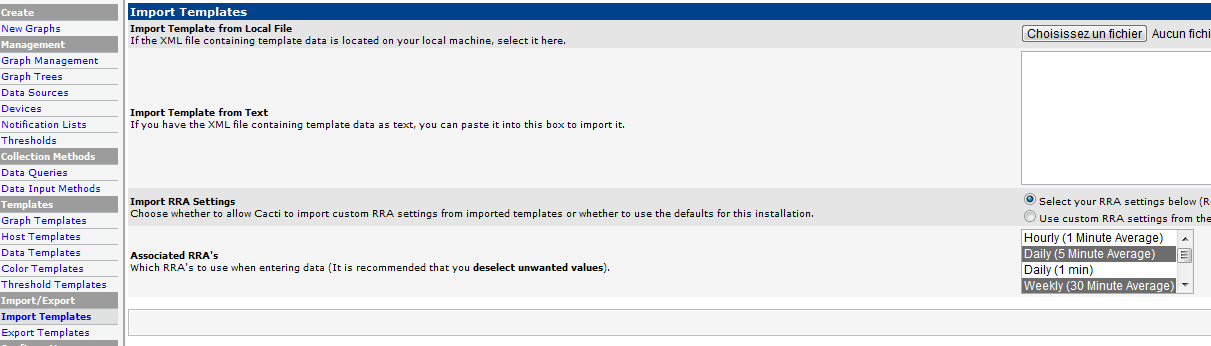
Then you need to upload this template to Cacti from the web interface. Go Under Import/Export and choose Import Templates and then upload the template.
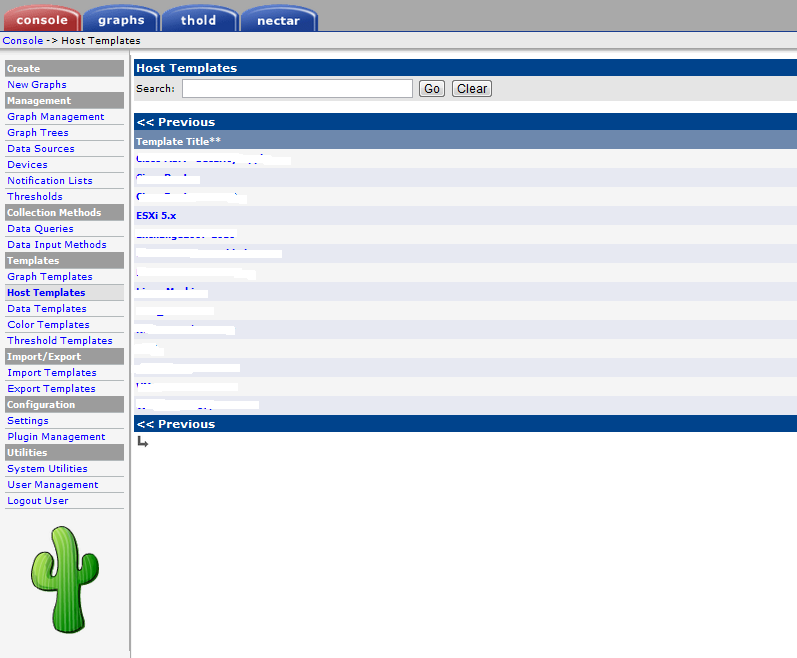
If the import is done, you should see the new template under Host Template
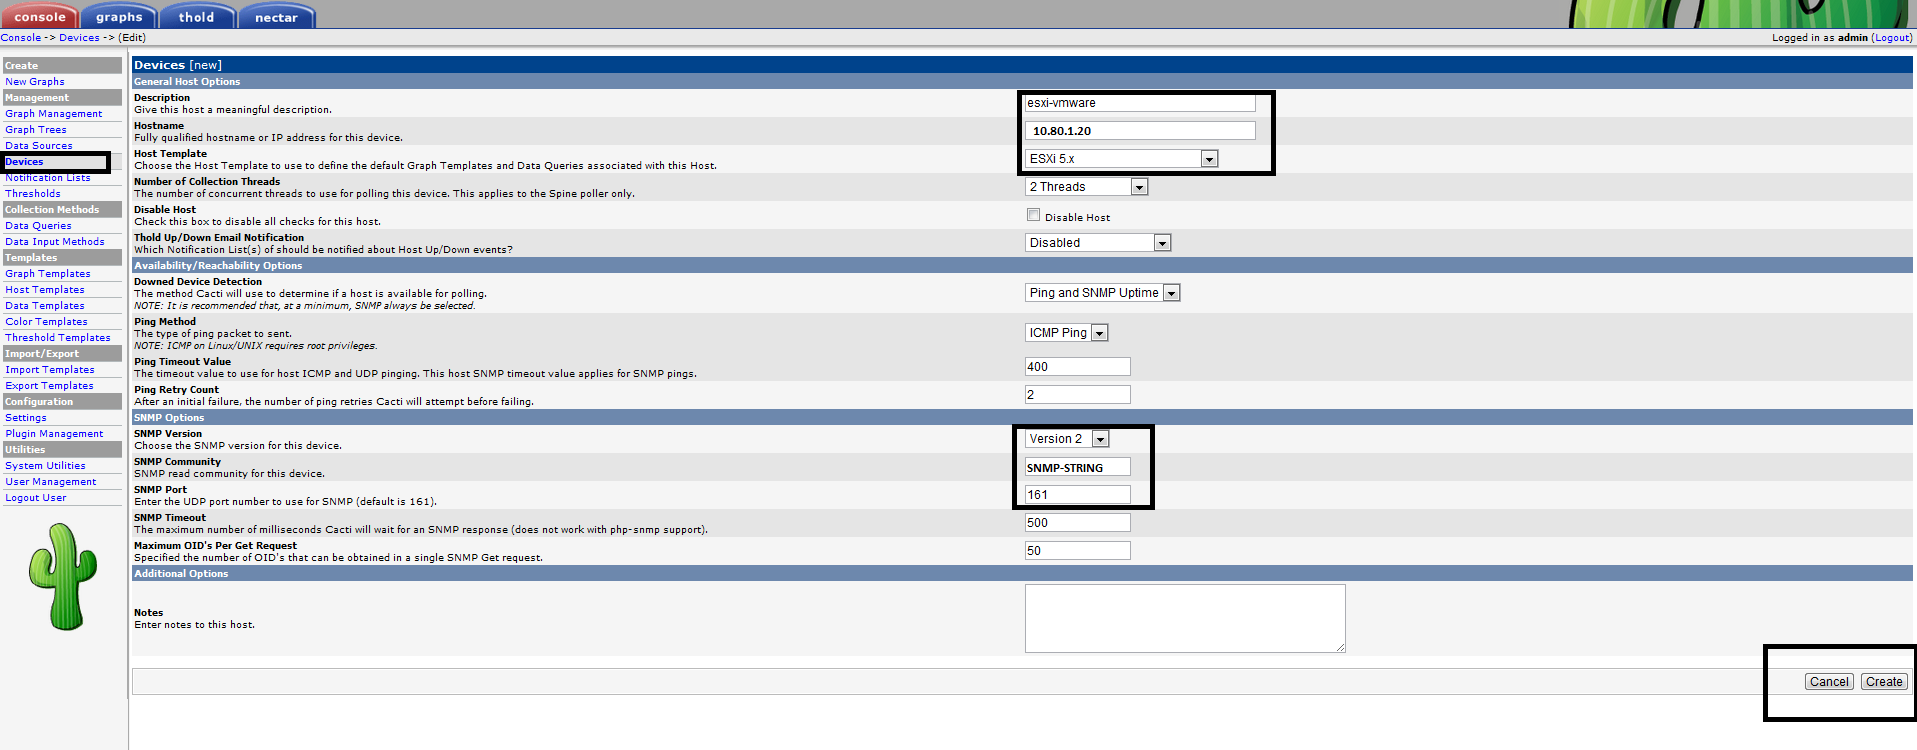
Once that is done you will need to add the new box as a device on your Cacti web interface. Click Add new Devices and choose ESXi5.x as Host template and don’t forget to make the snmp comunities.
After clicking Create you will see that you got the good snmp information like this example
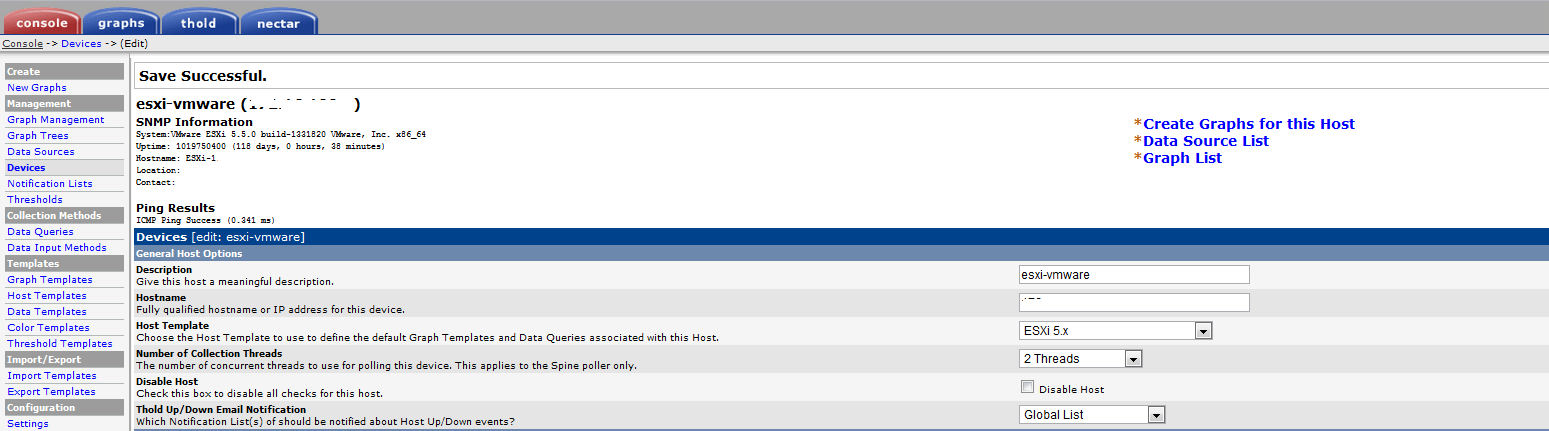
Now that the device has been added, we specify the graph templates that we want to create. This section can be found in the bottom section of the page.
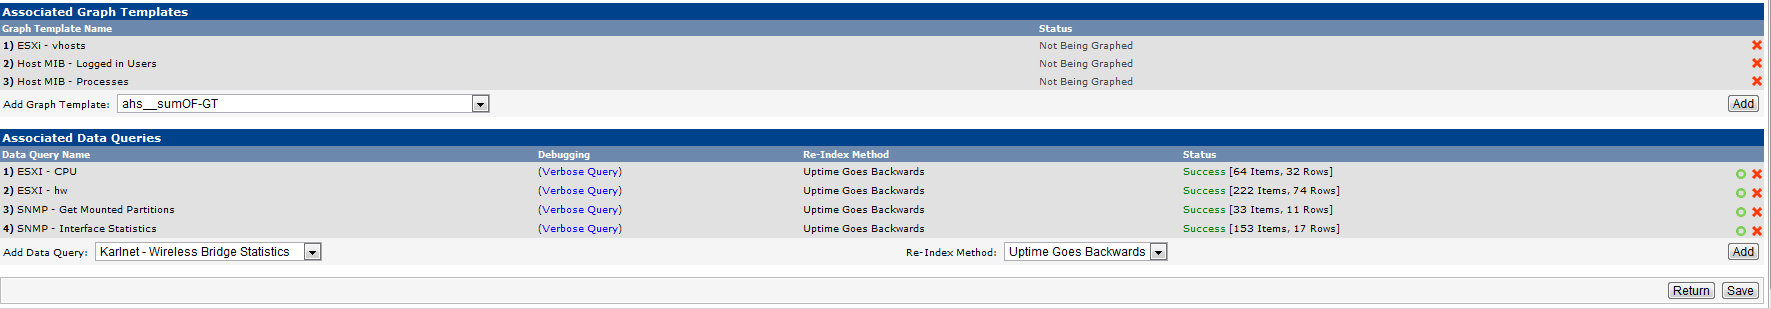
And then we proceed to creating the graphs.
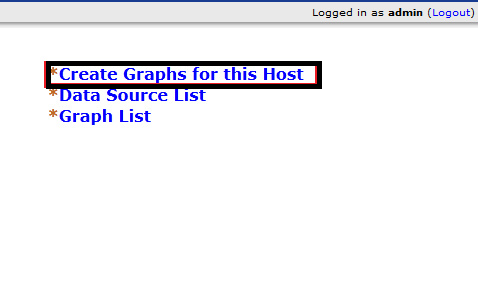
Here, we create graphs for datastores space used, network interfaces, users logged in, and memory consumed.
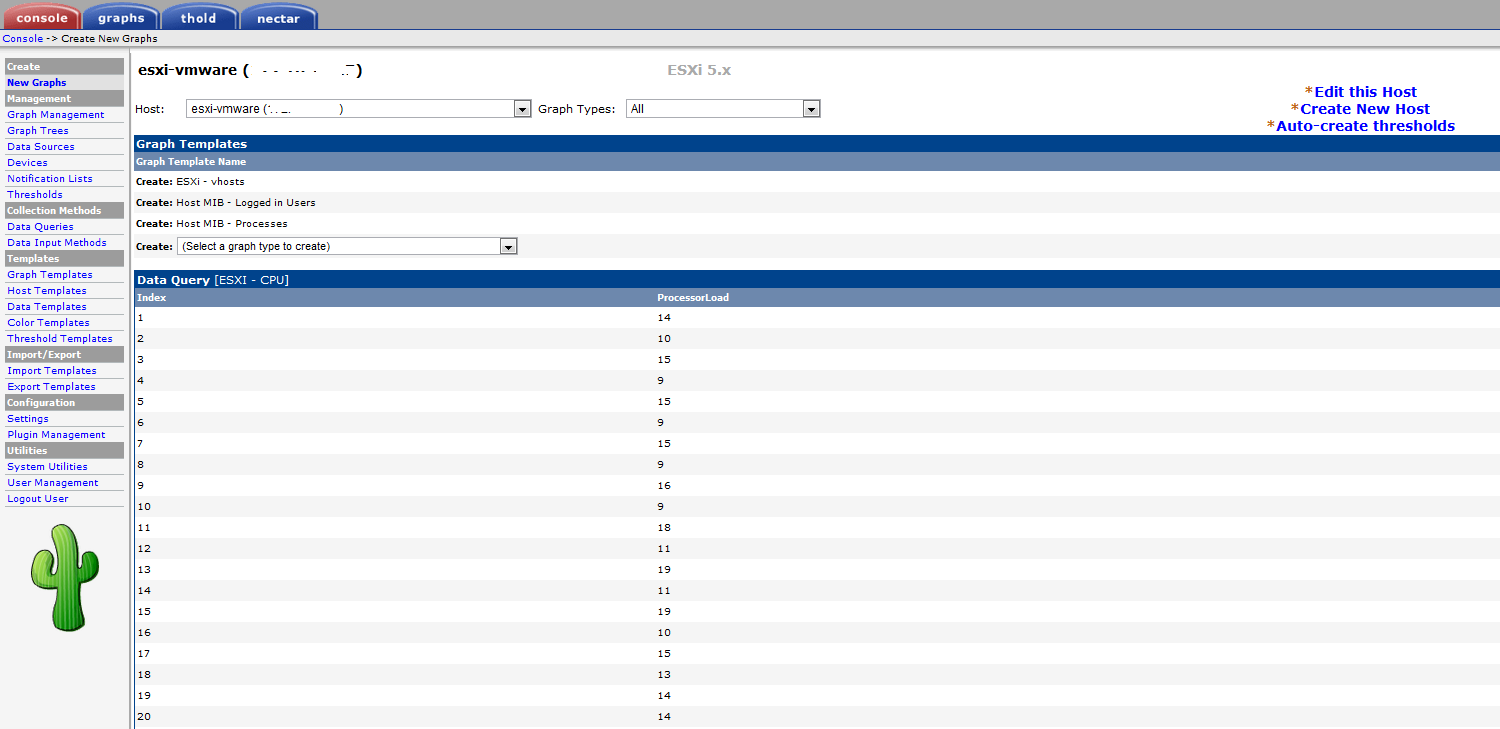
Choose the graphs that you want to add to your host. You should see all of your interfaces, datastores, real memory, etc…
Cacti takes around 15 minutes for Cacti to populate new graphs. And after that you will see graph like this example:
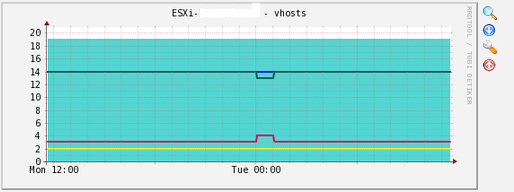
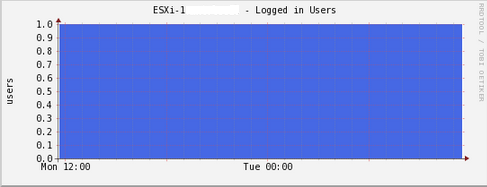
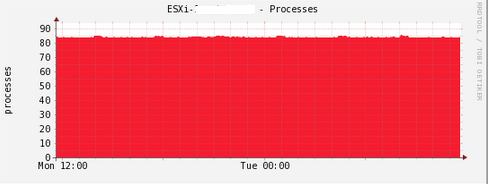
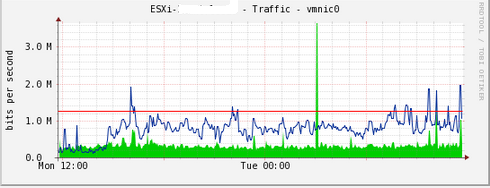
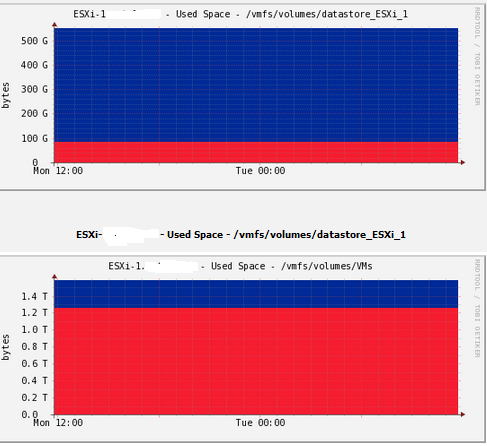
Done, now you areb able to monitor your VMware ESXi Host.
Thank you.


