
Ganglia is a scalable distributed monitoring system for high-performance computing systems such as clusters and Grids. It is based on a hierarchical design targeted at federations of clusters. It leverages widely used technologies such as XML for data representation, XDR for compact, portable data transport, and RRDtool for data storage and visualization.
It uses carefully engineered data structures and algorithms to achieve very low per-node overheads and high concurrency. The implementation is robust, has been ported to an extensive set of operating systems and processor architectures, and is currently in use on thousands of clusters around the world. It has been used to link clusters across university campuses and around the world and can scale to handle clusters with 2000 nodes.
Be mindful that Ganglia will only help you to view the performance of your servers, and it doesn’t tweak or improve the performance. In this tutorial, we are going to implement Ganglia Monitoring Tool on Ubuntu 13.10 server and let us use Ubuntu 13.04 as our Monitoring target. Though it was tested on Ubuntu 13.10, the same method should work on Debian 7 and other Ubuntu versions as well.
Install Ganglia On Ubuntu 13.10
Before proceeding to install Ganglia, you have to complete the following tasks.
Make sure your Server has a properly installed and configured LAMP stack. To install and configure LAMP server, refer the following link.
– Install LAMP Server On Ubuntu 13.10
If you’re using Debian, refer the following link.
– Install LAMP Server On Debian 7
Ganglia consists of two main daemons called gmond (Ganglia Monitoring Daemon) and gmetad (Ganglia Meta Daemon), a PHP-based web front-end and a few other small utilities.
Ganglia Monitoring Daemon (gmond):
Gmond runs on each node you want to monitor and monitor changes in the host state, announce relevant changes, listen to the state of all other ganglia nodes via a unicast or multicast channel and answer requests for an XML description of the cluster state.
Ganglia Meta Daemon (gmetad):
Gmetad runs on the master node which gathers all information from the client nodes.
Ganglia PHP Web Front-end:
It displays all the gathered information from the clients in a meaningful way like graphs via web pages.
Ganglia Installation On Master node
Install Ganglia using command:
$ sudo apt-get install ganglia-monitor rrdtool gmetad ganglia-webfrontend
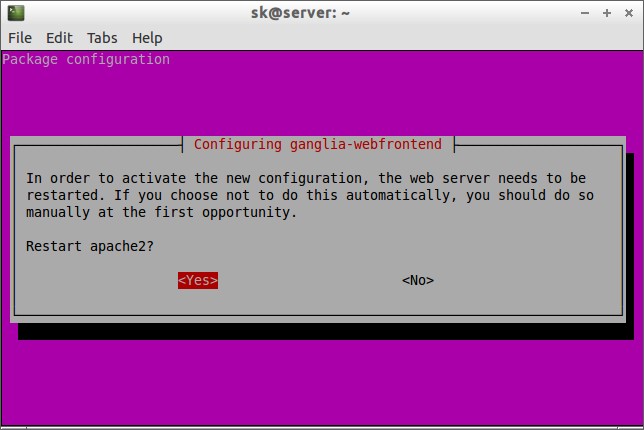
During installation, you’ll be asked to restart apache service to activate the new configuration. Click Yes to continue.
Configure Master node
Now copy ganglia configuration file /etc/ganglia-webfrontend/apache.conf to /etc/apache2/sites-enabled/ directory as shown below.
$ sudo cp /etc/ganglia-webfrontend/apache.conf /etc/apache2/sites-enabled/ganglia.conf
Then edit file /etc/ganglia/gmetad.conf,
$ sudo nano /etc/ganglia/gmetad.conf
Find the following line and modify as shown below.
data_source "my cluster" 50 192.168.1.101:8649
As per the above line, the logs will be collected from each node every 50 seconds. Also, you can assign a name for your client groups. In my case, I use the default group name “my cluster”. Here 192.168.1.101 is my master node IP address.
Save and close the file.
Edit file /etc/ganglia/gmond.conf,
$ sudo nano /etc/ganglia/gmond.conf
Find the following sections and modify them with your values.
[...]
cluster {
  name = "my cluster"  ## Name assigned to the client groups
  owner = "unspecified"
  latlong = "unspecified"
  url = "unspecified"
}

[...]

udp_send_channel   {
#mcast_join = 239.2.11.71 ## Comment
  host = 192.168.1.101   ## Master node IP address
  port = 8649
  ttl = 1
}

[...]

udp_recv_channel {
  port = 8649
}

/* You can specify as many tcp_accept_channels as you like to share
   an xml description of the state of the cluster */
tcp_accept_channel {
  port = 8649
}

[...]
The changes in the above configuration file show that the master node which has IP address 192.168.1.101 will collect data from all nodes on tcp and udp port 8649.
Save and close the file. Then start ganglia-monitor, gmetad and apache services.
$ sudo /etc/init.d/ganglia-monitor start
$ sudo /etc/init.d/gmetad start
$ sudo /etc/init.d/apache2 restart
Ganglia Installation On Clients
Install the following package for each client you want to monitor.
On Debian / Ubuntu clients:
$ sudo apt-get install ganglia-monitor
On RHEL based clients:
# yum install ganglia-gmond
Configure Clients
Edit file /etc/ganglia/gmond.conf,
$ sudo nano /etc/ganglia/gmond.conf
Make the changes as shown below.
[...]

cluster {
  name = "my cluster"     ## Cluster name
  owner = "unspecified"
  latlong = "unspecified"
  url = "unspecified"

[...]

udp_send_channel {
  #mcast_join = 239.2.11.71   ## Comment
  host = 192.168.1.104   ## IP address of master node
  port = 8649
  ttl = 1
}
## Comment the whole section
/* You can specify as many udp_recv_channels as you like as well.
udp_recv_channel {
  mcast_join = 239.2.11.71
  port = 8649
  bind = 239.2.11.71
}
*/

tcp_accept_channel {
  port = 8649
}

[...]
Save and close the file. Next, restart ganglia-monitor service.
On Debian based systems:
$ sudo /etc/init.d/ganglia-monitor restart
On RHEL based systems:
# service gmond restart
Access Ganglia web frontend
Now point your web browser with URL http://ip-address/ganglia. You should see the client node graphs.
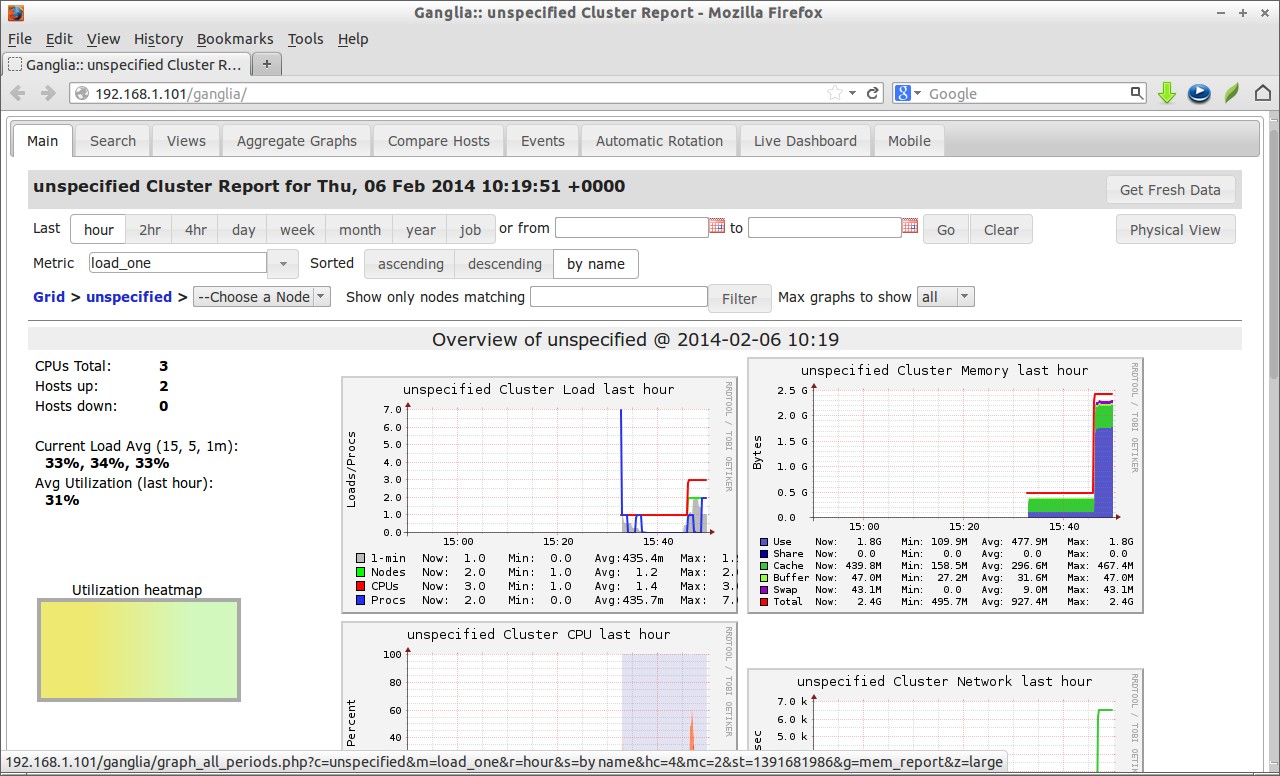
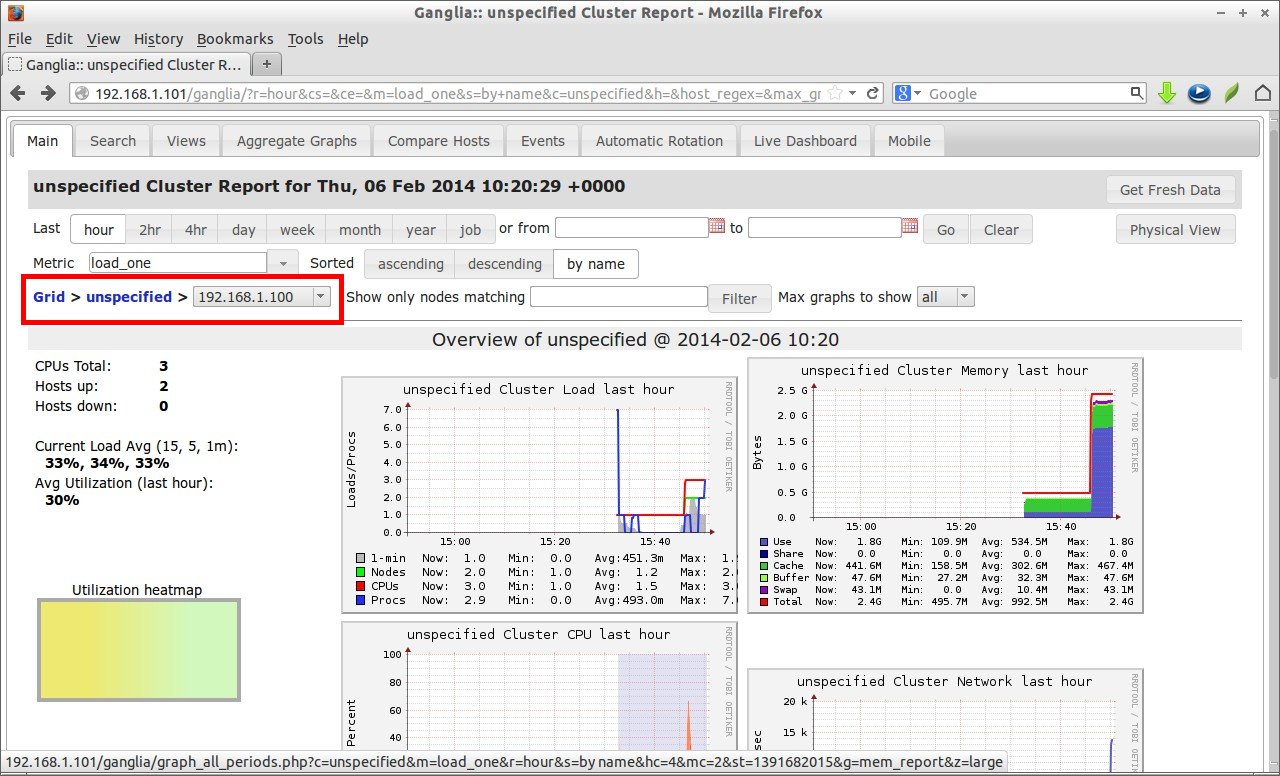
To view a particular node graphs, select the particular node you want from the Grid Choose Node drop-down box.
For example, i want to see the graphs of Ubuntu client which has IP address 192.168.1.100.
Graphs of my Ubuntu client (192.168.1.100) client:
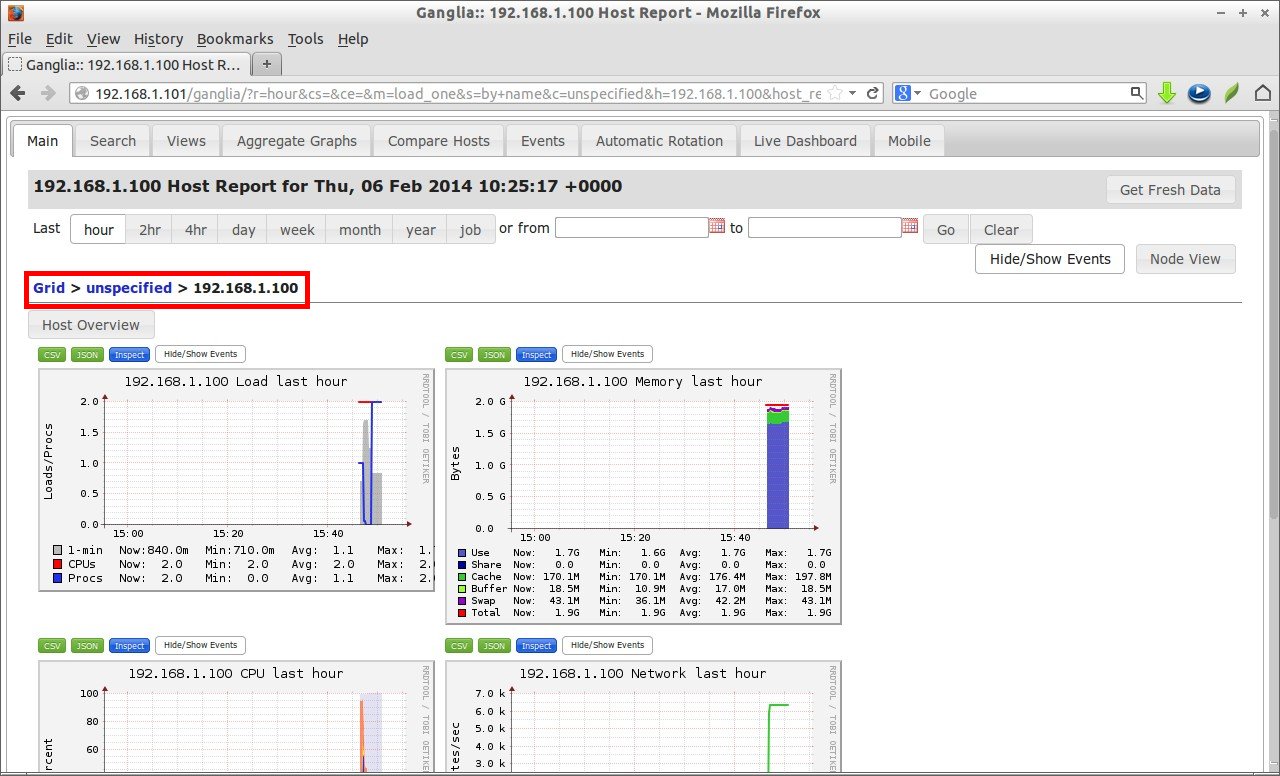
Client Node View:
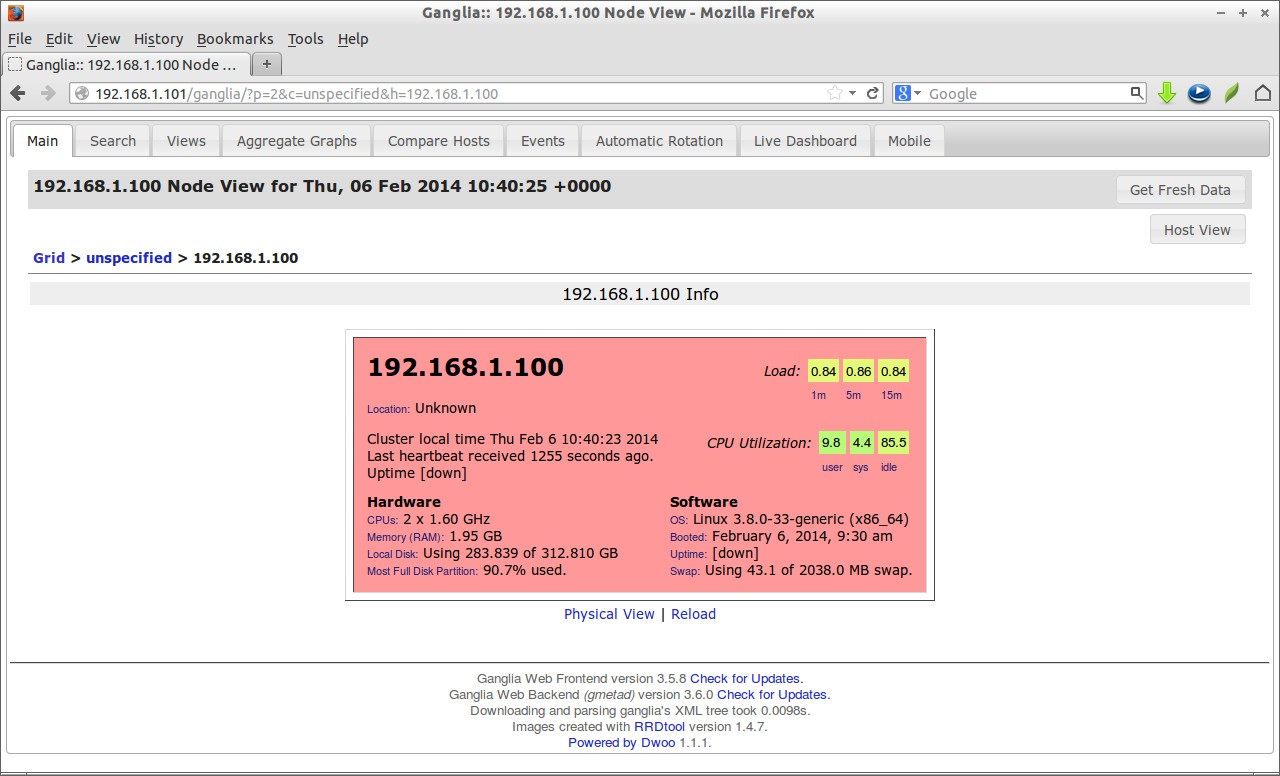
Server Node view:
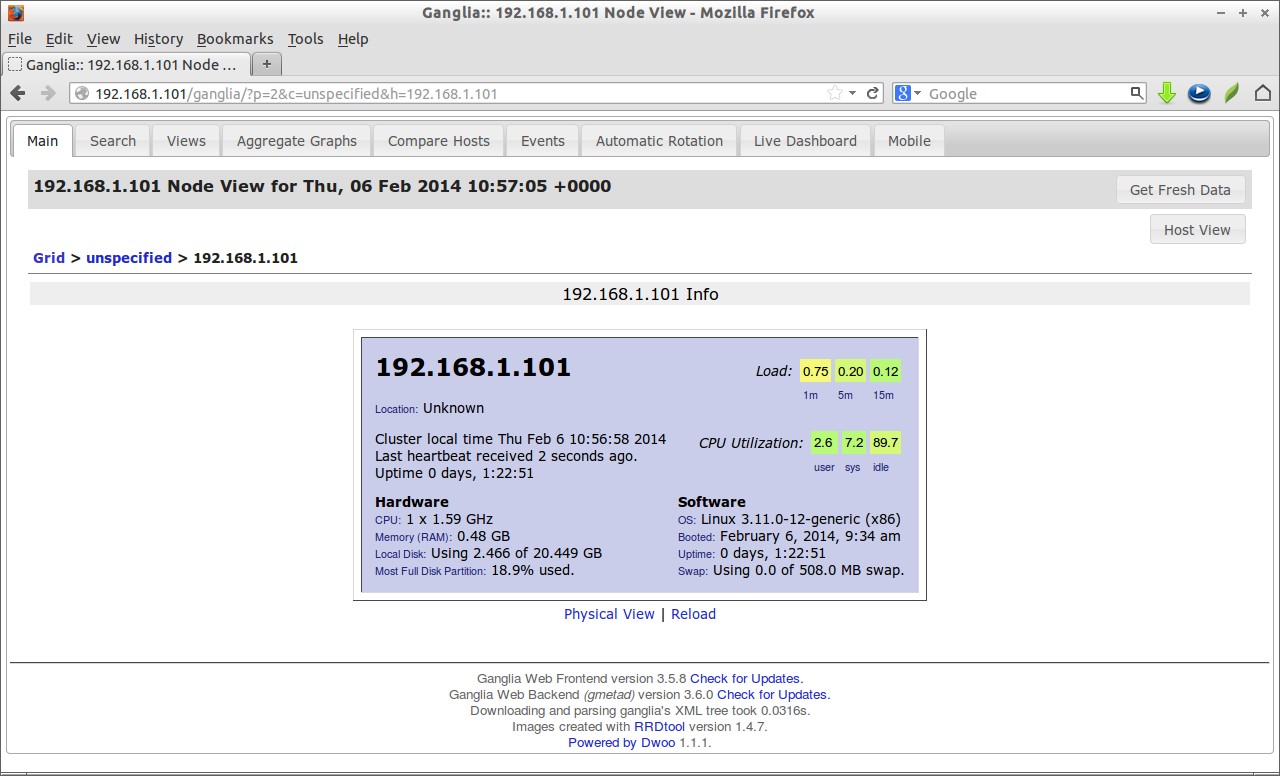
As you see in the above outputs, my client node (192.168.1.101) is down and server node (192.168.1.100) is up.
Source & Reference Links:


